BlackRock Results Presentation Deck
7%
5%
$129
$30
$99
11%
$1
$75
6%
4%
$14
$35
Q4 Q1
2019 2020
$53
T($19)
9%
$14
5%
5%
$100
$24
$62
Long-term
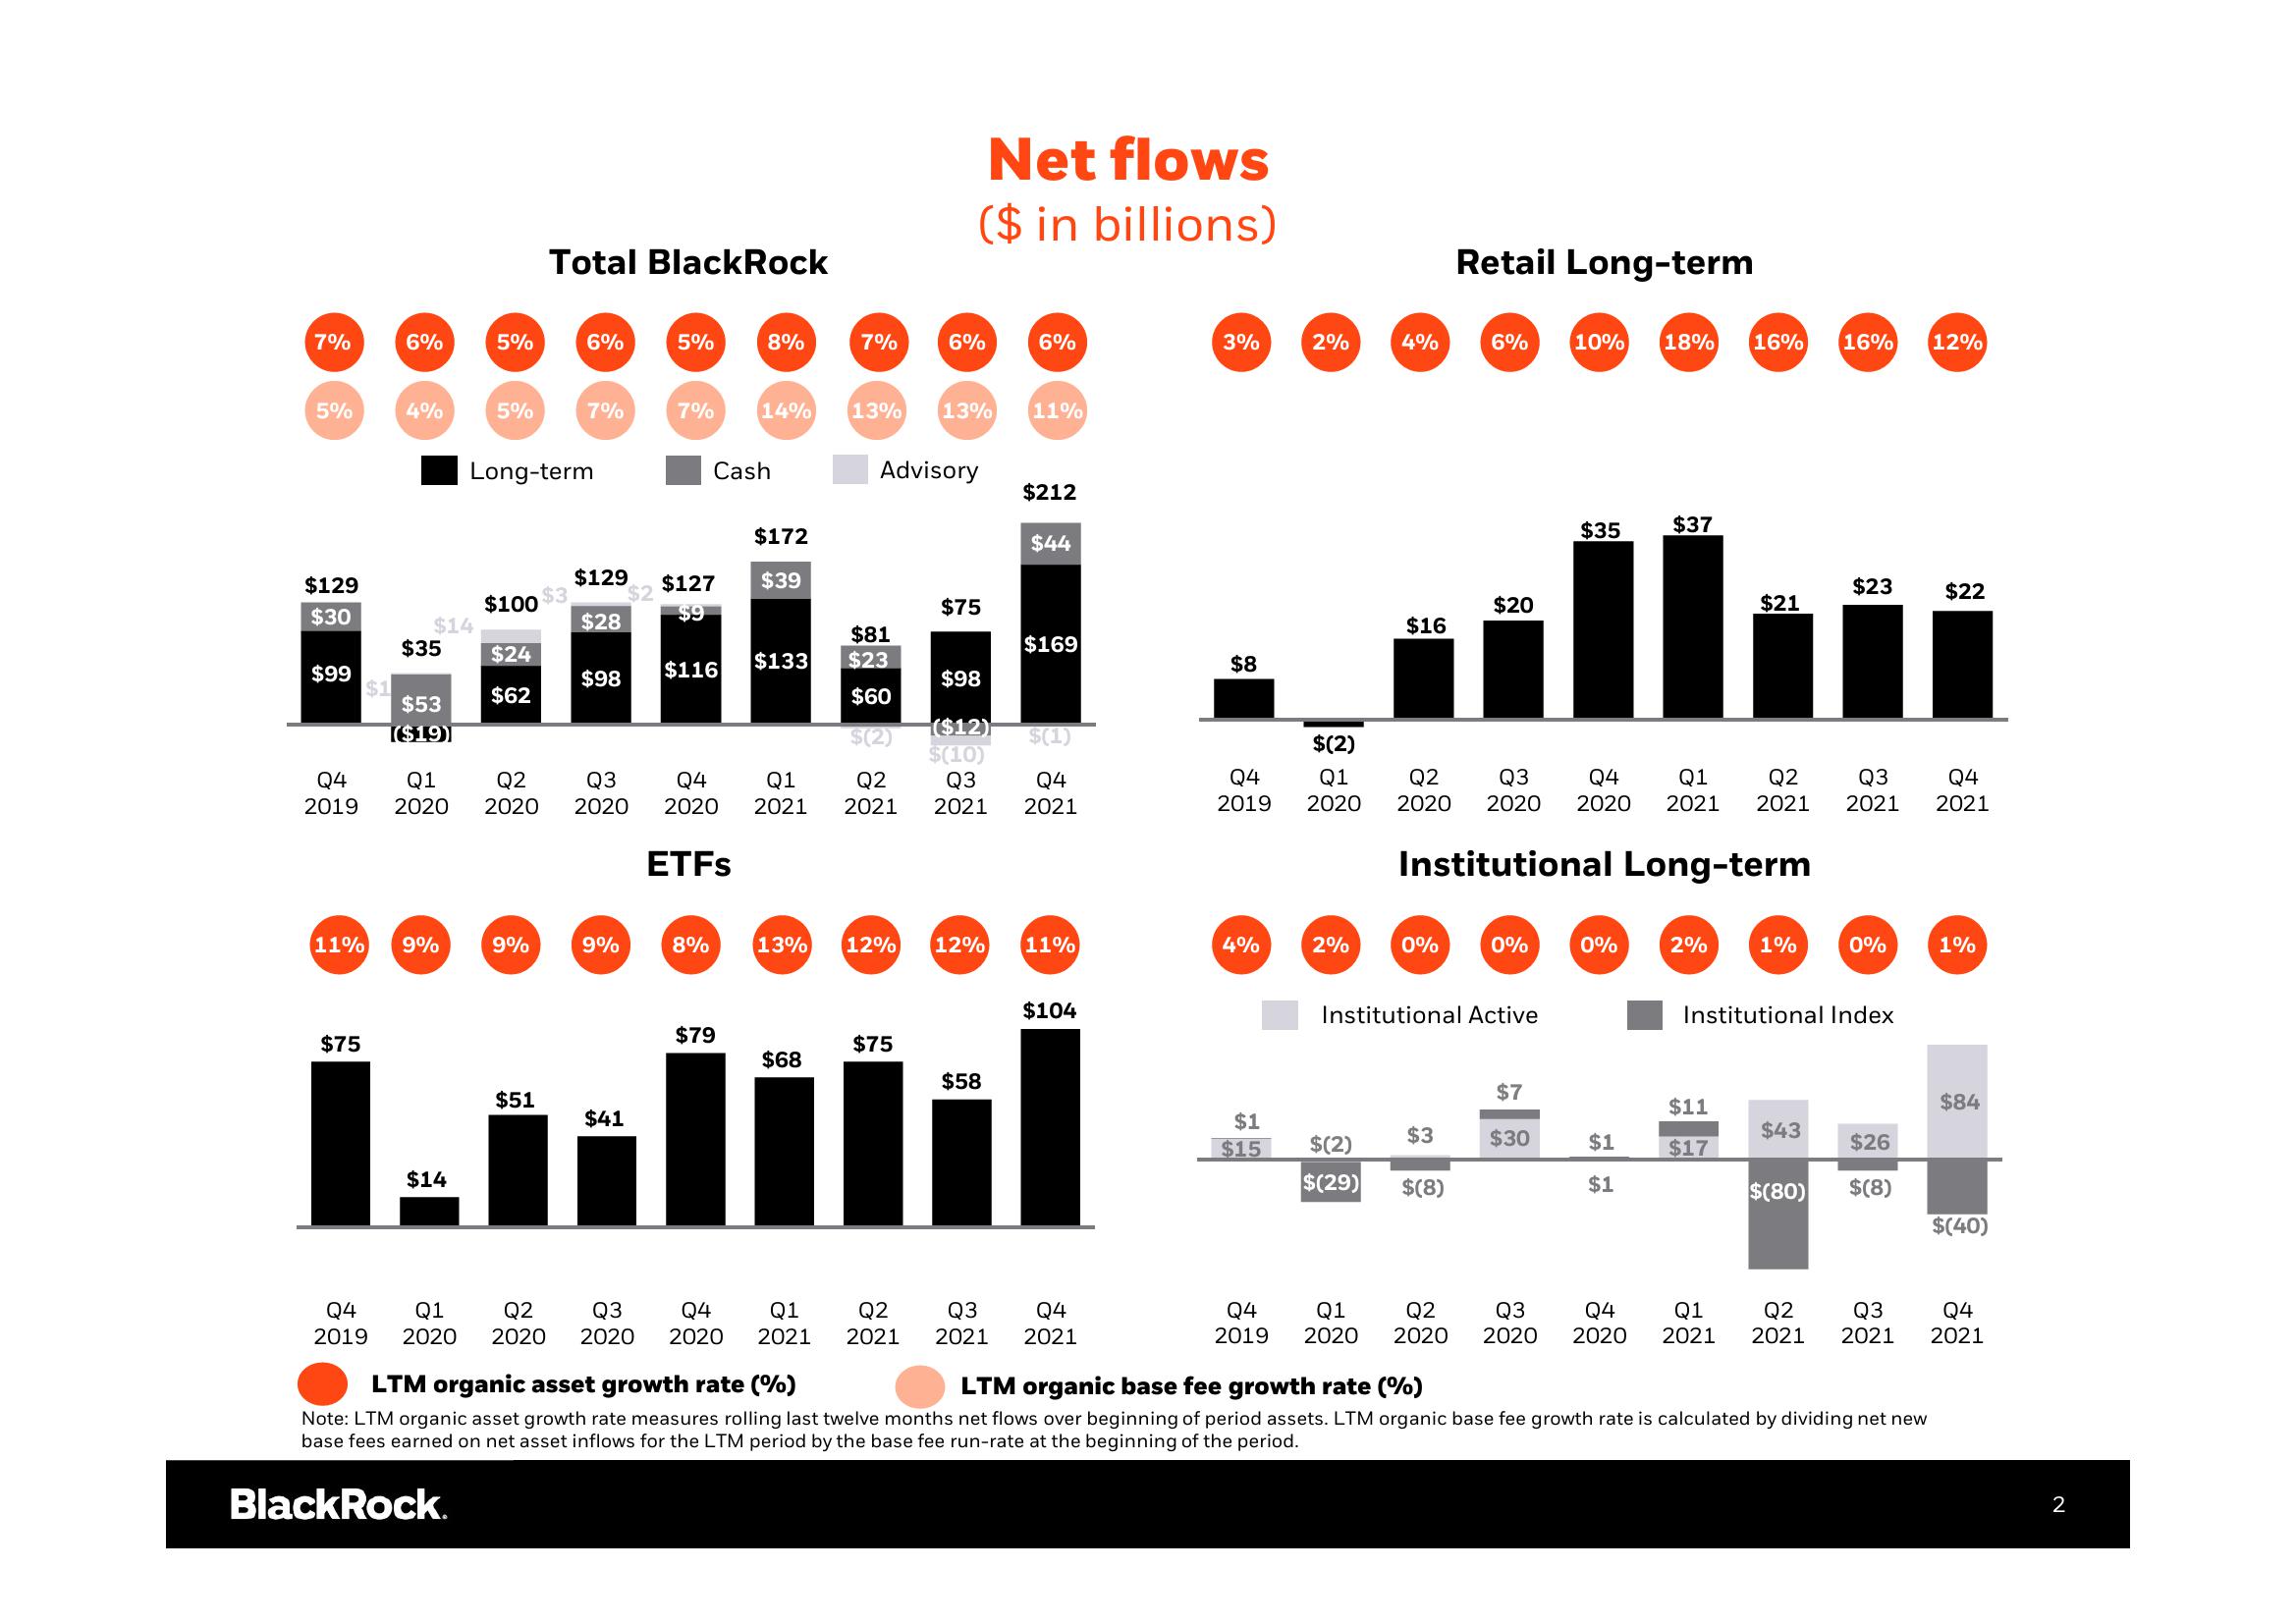
Total BlackRock
9%
6%
$51
7%
$129
$3. $2
$28
$98
9%
5%
$41
7%
$81
$133 $23
$60
$(2)
Q2 Q3 Q4 Q1 Q2
2020 2020 2020 2021 2021
ETFs
8%
Cash
$172
$127 $39
$9
$116
8%
14%
$79
7%
13%
$68
Net flows
($ in billions)
Advisory
$75
6%
Q3
Q4
Q1
Q4 Q1 Q2
Q2
2019 2020 2020 2020 2020 2021 2021
13%
13% 12% 12%
$75
6%
$58
11%
$212
$44
$98
$(1)
($12)
$(10)
Q3 Q4
2021 2021
$169
11%
$104
Q3
Q4
2021 2021
3%
$8
Q4
2019
4%
$1
$15
2%
$(2)
Q1
2020
2%
4%
$16
0%
Retail Long-term
6%
$3
$(2)
$(29) $(8)
$20
0%
Institutional Active
Q2 Q3 Q4 Q1 Q2
2020 2020 2020 2021 2021
Institutional Long-term
10% 18%
$7
$30
$35 $37
0%
$1
$1
2%
16%
$21
$11
$17
1%
$43
16% 12%
$(80)
$23 $22
Institutional Index
Q3
2021
0%
$26
$(8)
Q4 Q1 Q2 Q3 Q4 Q1 Q2 Q3
2019 2020 2020 2020 2020 2021 2021 2021
LTM organic base fee growth rate (%)
LTM organic asset growth rate (%)
Note: LTM organic asset growth rate measures rolling last twelve months net flows over beginning of period assets. LTM organic base fee growth rate is calculated by dividing net new
base fees earned on net asset inflows for the LTM period by the base fee run-rate at the beginning of the period.
BlackRock.
Q4
2021
1%
$84
$(40)
Q4
2021
2View entire presentation