Telia Company Results Presentation Deck
Cash Flow
Reported currency, SEK billions
Adjusted EBITDA
Restructuring and other adj. items
Repayment of leasing liabilities
Cash CAPEX excl. licenses
Interest paid net
Taxes paid
Other items
Structural part of OFCF
Working capital
Operational free cash flow
Q1 2023
7.3
-0.6
-0.8
-4.1
-1.0
-0.5
0.5
0.7
-4.3
-3.6
Q1 2022
7.2
-0.3
-0.8
-3.0
-0.9
-0.6
0.3
1.9
0.2
2.2
Change
0.1
-0.3
-0.1
-1.1
-0.1
0.1
0.2
-1.3
-4.5
-5.8
-
16
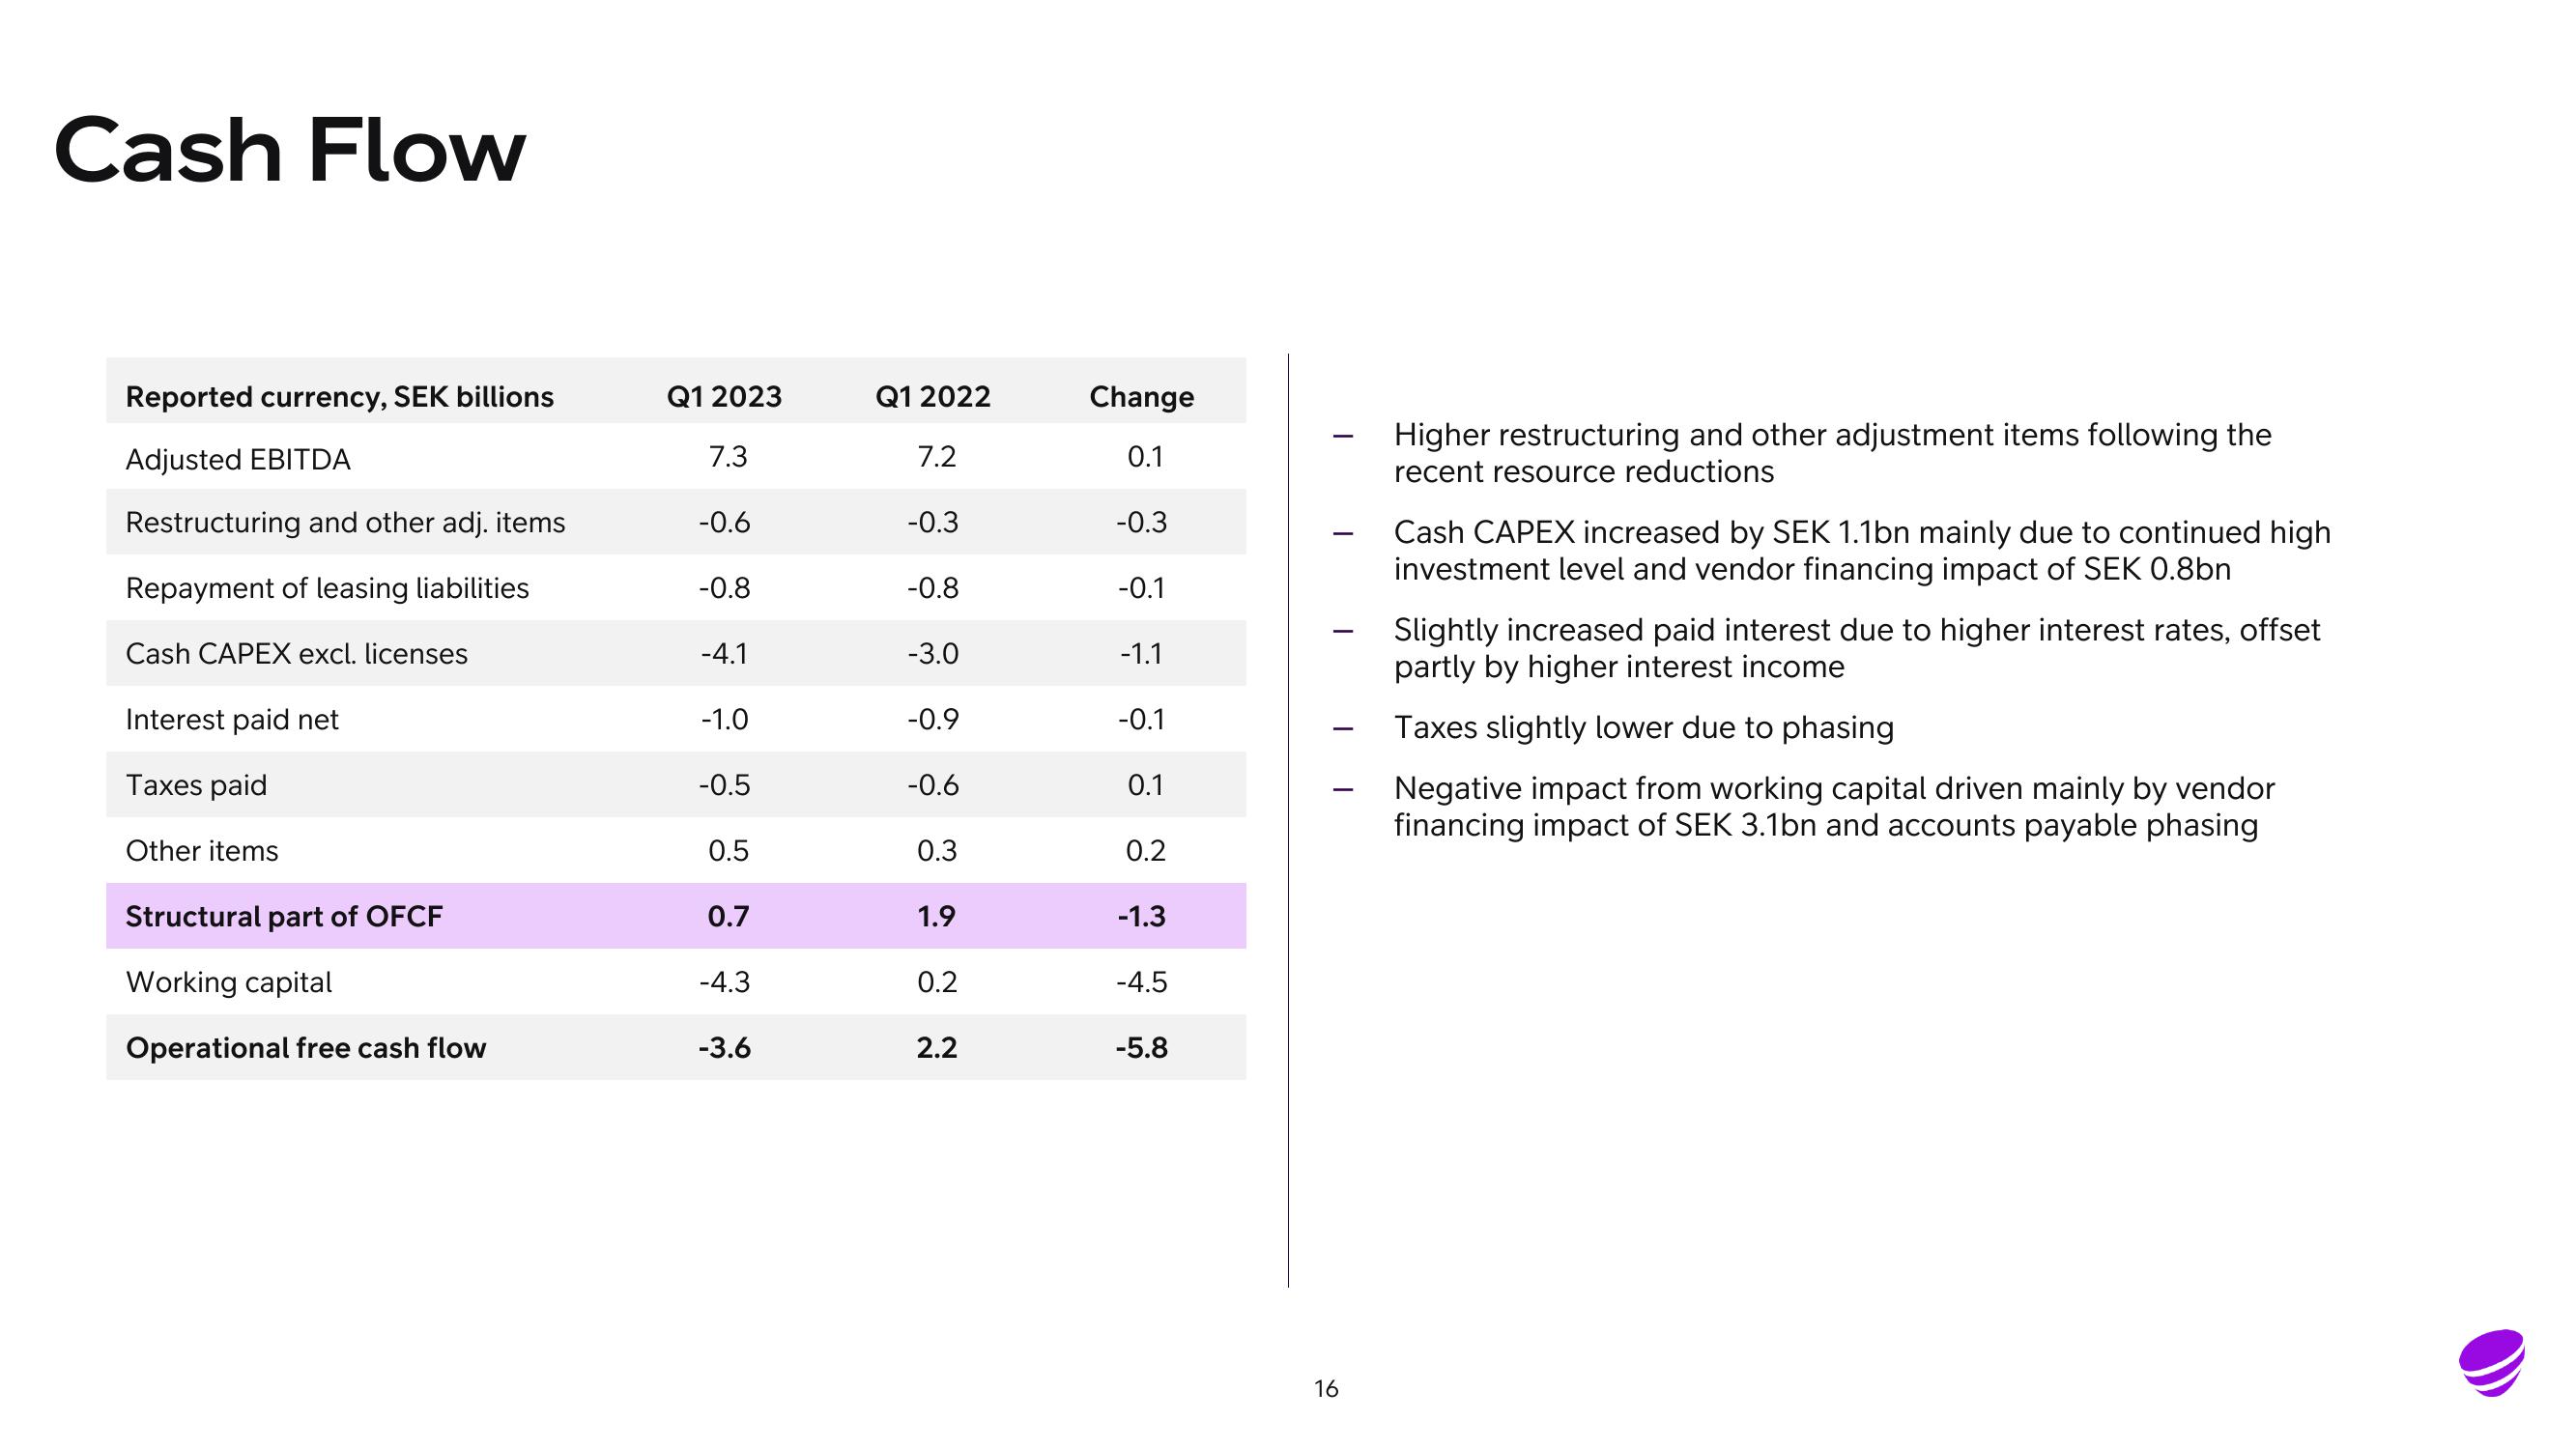
Higher restructuring and other adjustment items following the
recent resource reductions
Cash CAPEX increased by SEK 1.1bn mainly due to continued high
investment level and vendor financing impact of SEK 0.8bn
Slightly increased paid interest due to higher interest rates, offset
partly by higher interest income
Taxes slightly lower due to phasing
Negative impact from working capital driven mainly by vendor
financing impact of SEK 3.1bn and accounts payable phasingView entire presentation