Telia Company Results Presentation Deck
Norway
Service revenues
Reported currency, in SEK millions, like for like growth
2,756
Q1 21
2,827
Q2 21
Consumer
+6.6%
2,913
Q3 21
3,014
Q4 21
Enterprise ■ Other
3,146
Q1 22
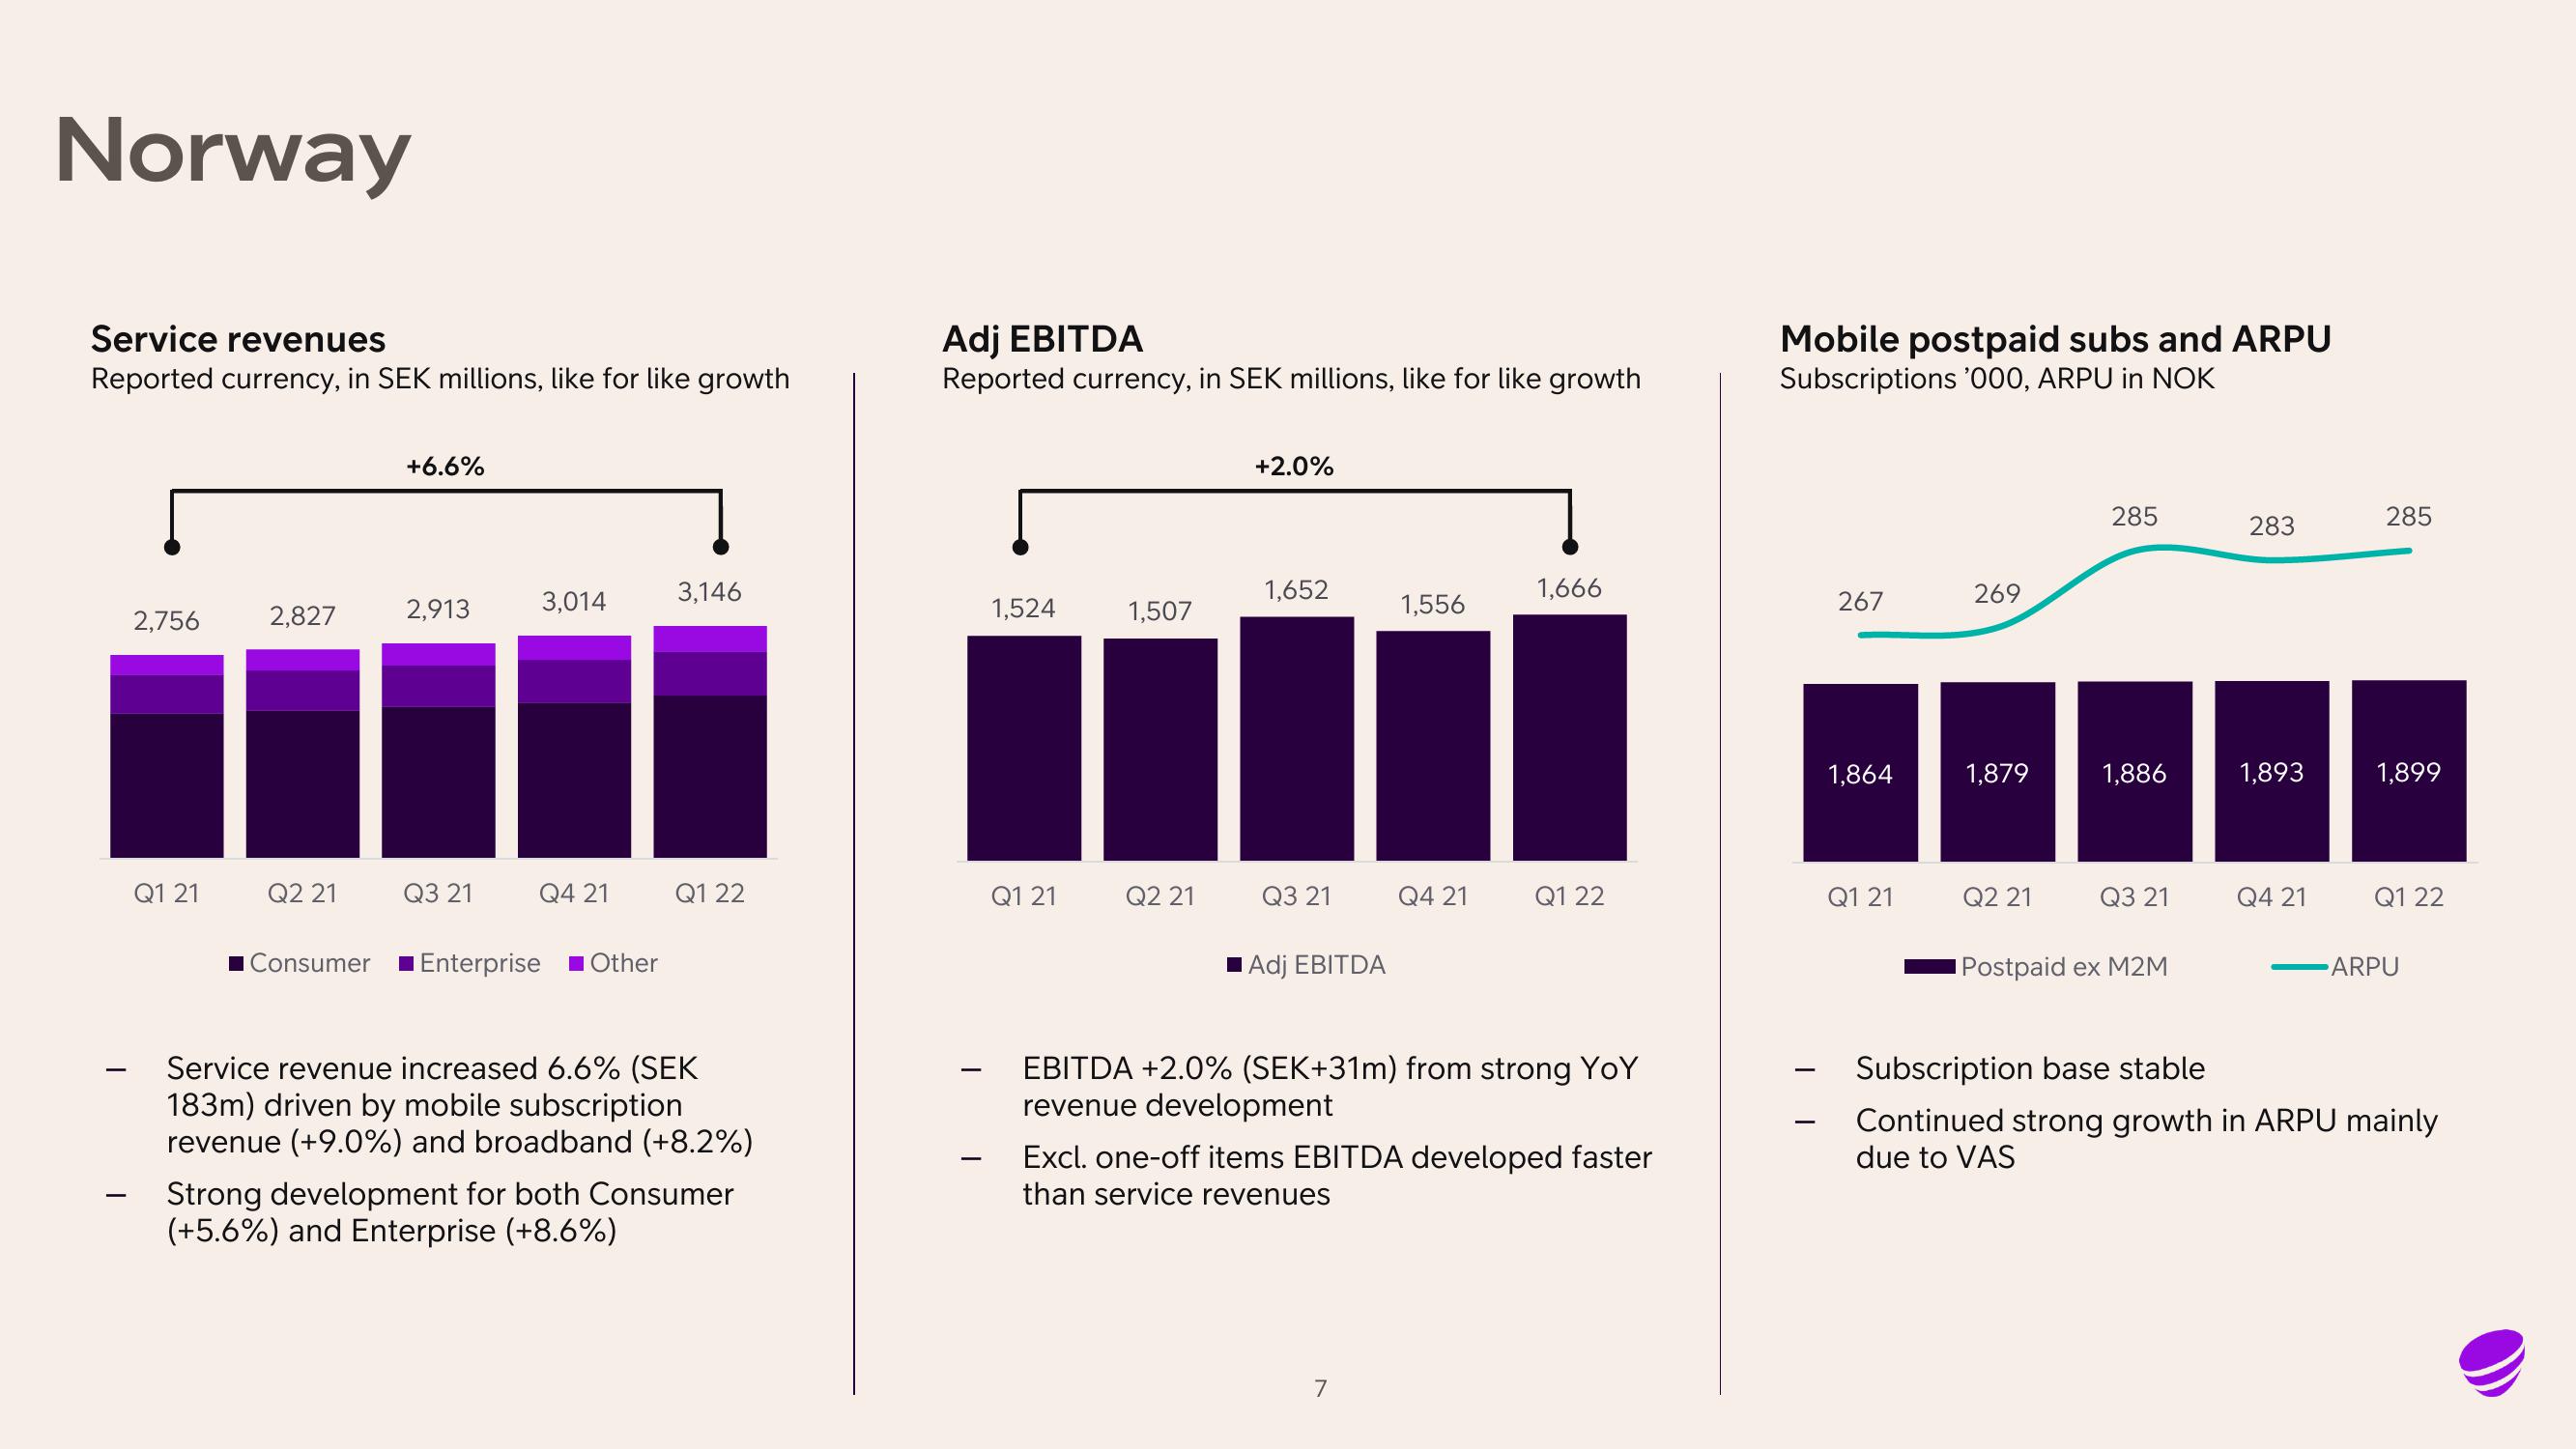
Service revenue increased 6.6% (SEK
183m) driven by mobile subscription
revenue (+9.0%) and broadband (+8.2%)
Strong development for both Consumer
(+5.6%) and Enterprise (+8.6%)
Adj EBITDA
Reported currency, in SEK millions, like for like growth
1,524
Q1 21
1,507
Q2 21
+2.0%
1,652
Q3 21
Adj EBITDA
1,556
Q4 21
7
1,666
Q1 22
EBITDA +2.0% (SEK+31m) from strong YoY
revenue development
Excl. one-off items EBITDA developed faster
than service revenues
Mobile postpaid subs and ARPU
Subscriptions '000, ARPU in NOK
267
1,864
Q1 21
269
1,879
Q2 21
285
1,886
Q3 21
Postpaid ex M2M
283
1,893
Q4 21
285
1,899
Q1 22
ARPU
Subscription base stable
Continued strong growth in ARPU mainly
due to VASView entire presentation