Palantir Results Presentation Deck
O)
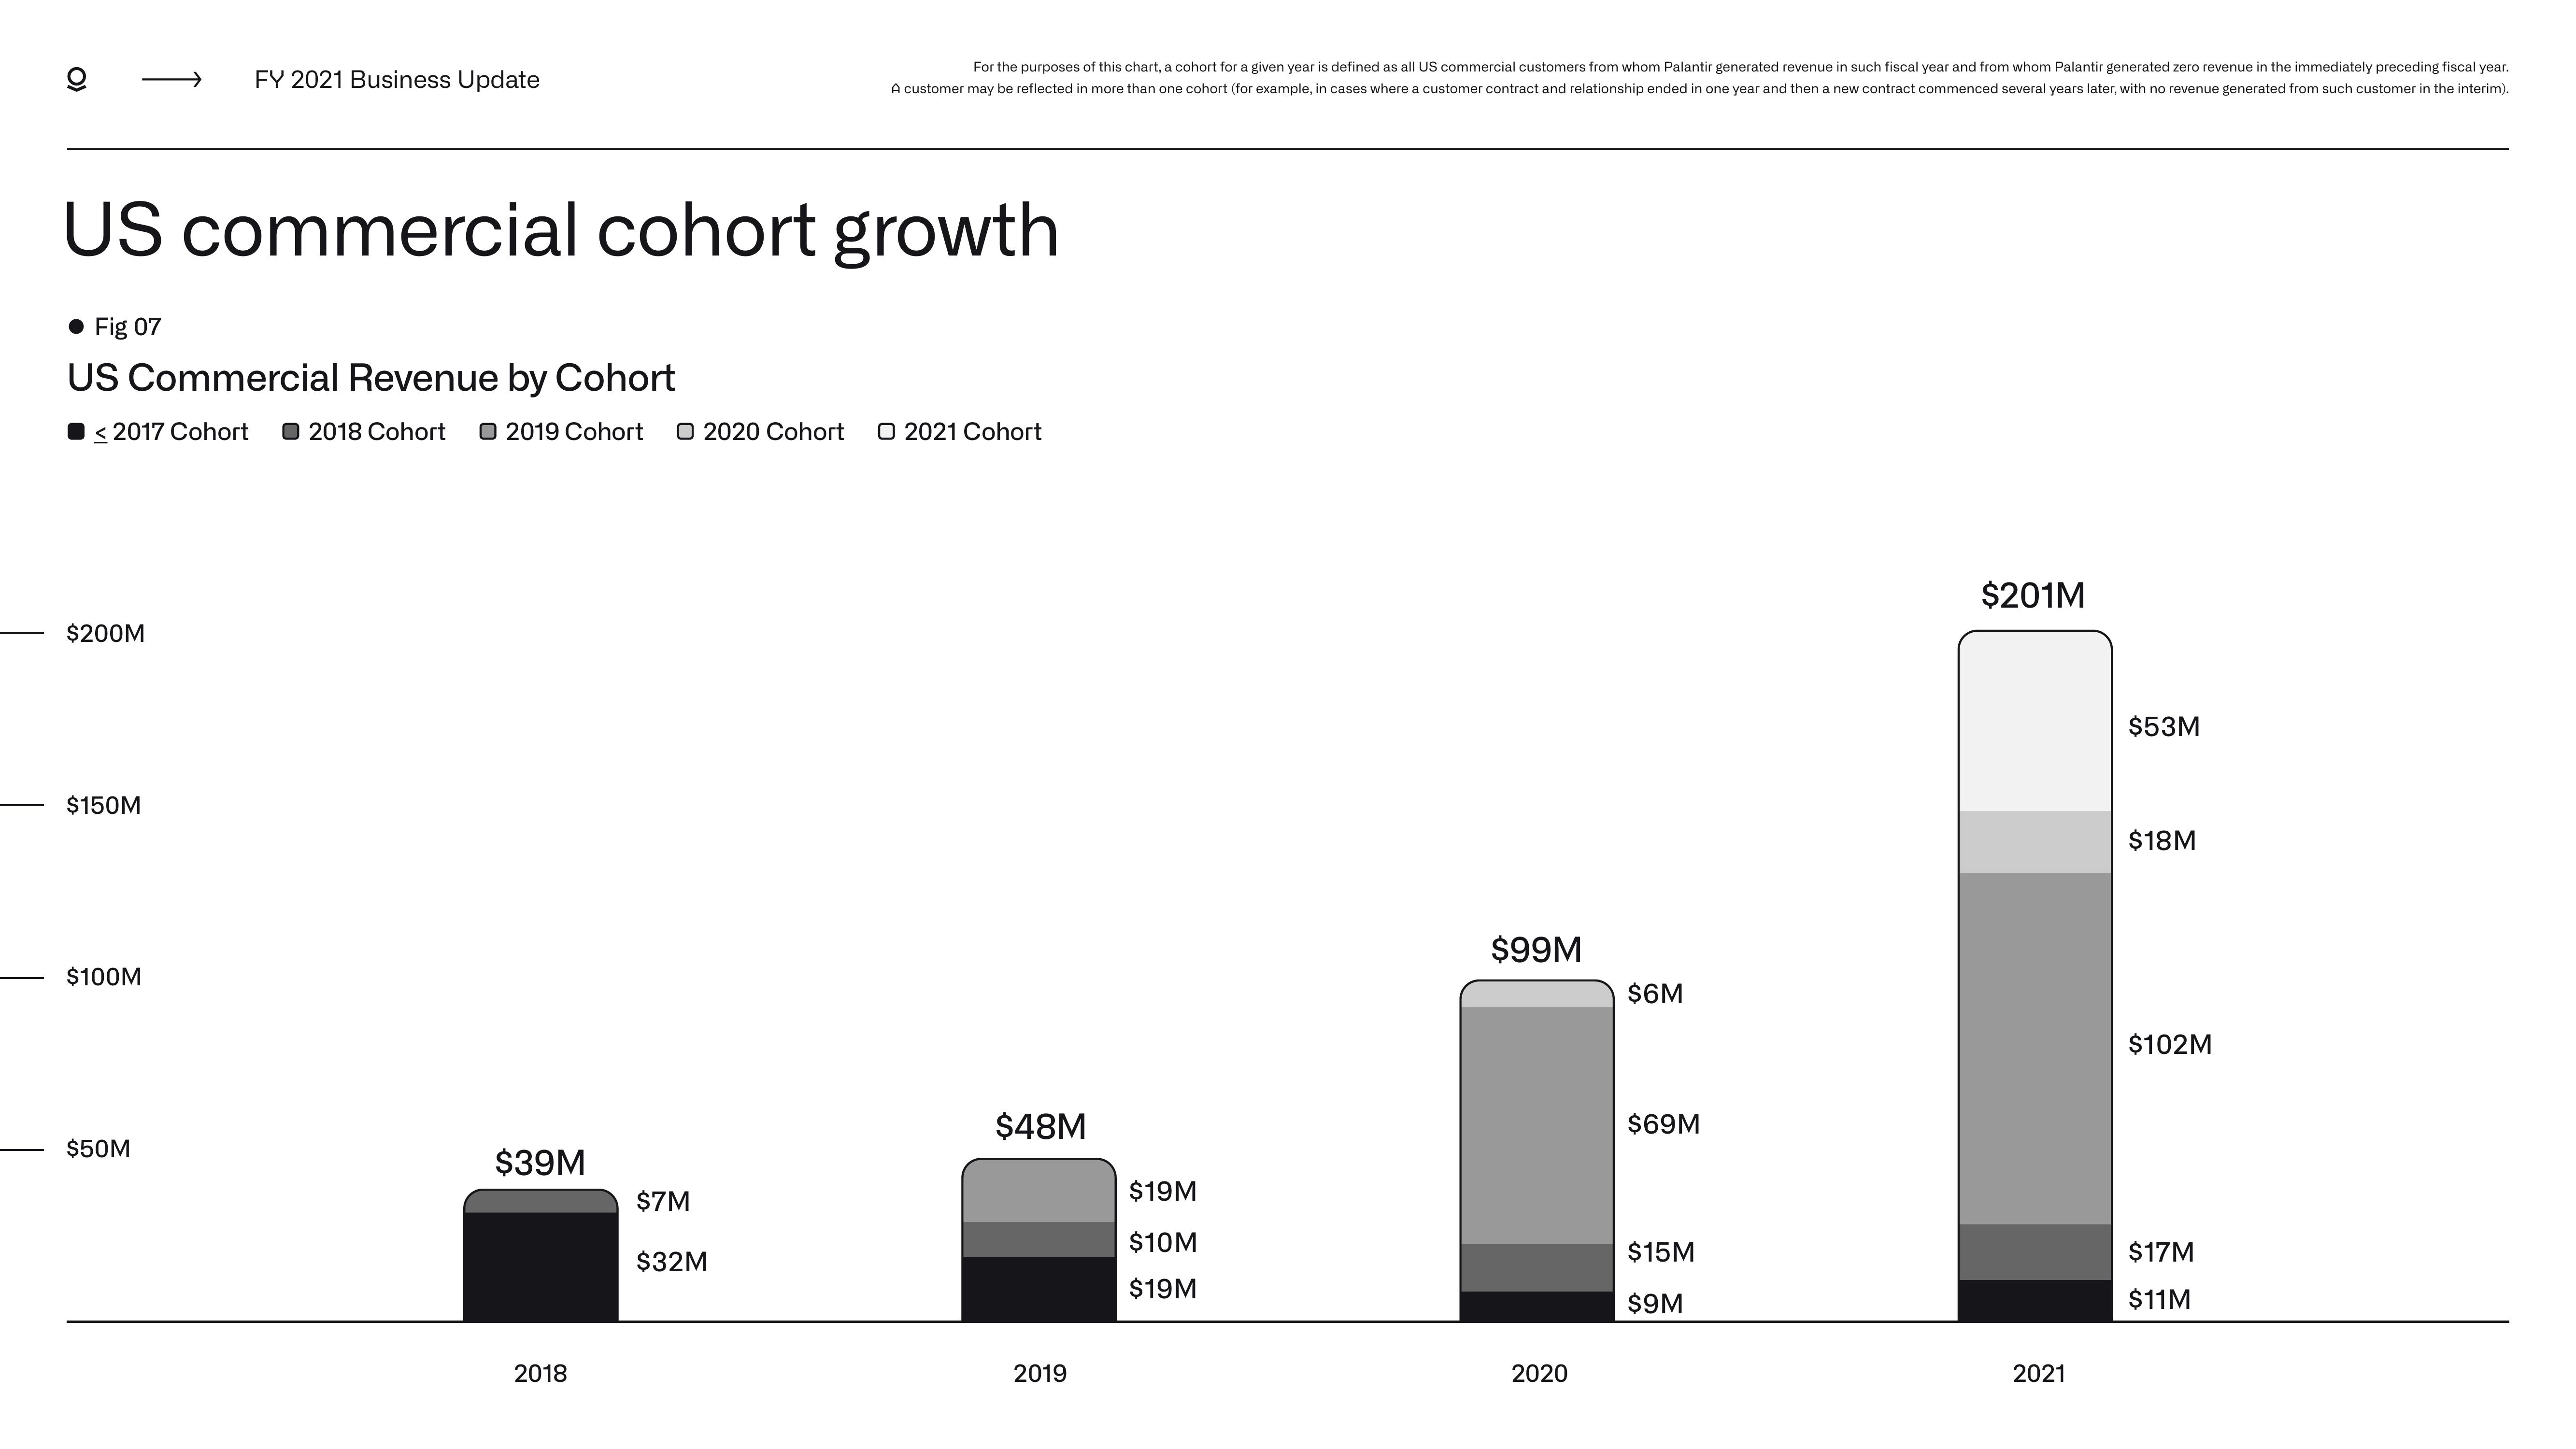
US commercial cohort growth
$200M
● Fig 07
US Commercial Revenue by Cohort
2017 Cohort 2018 Cohort 2019 Cohort O 2020 Cohort O 2021 Cohort
$150M
FY 2021 Business Update
$100M
$50M
$39M
For the purposes of this chart, a cohort for a given year is defined as all US commercial customers from whom Palantir generated revenue in such fiscal year and from whom Palantir generated zero revenue in the immediately preceding fiscal year.
A customer may be reflected in more than one cohort (for example, cases where a customer contract and relationship ended in one year and then a new contract commenced several years later, with no revenue generated from such customer in the interim).
2018
$7M
$32M
8M
2019
$19M
$10M
$19M
$99M
2020
$6M
$69M
$15M
$9M
$201M
2021
$53M
$18M
$102M
$17M
$11MView entire presentation