Snap Inc Investor Presentation Deck
Snap Inc.
In millions,
unaudited
YoY
Change
$1,180
2018
43%
35%
2018
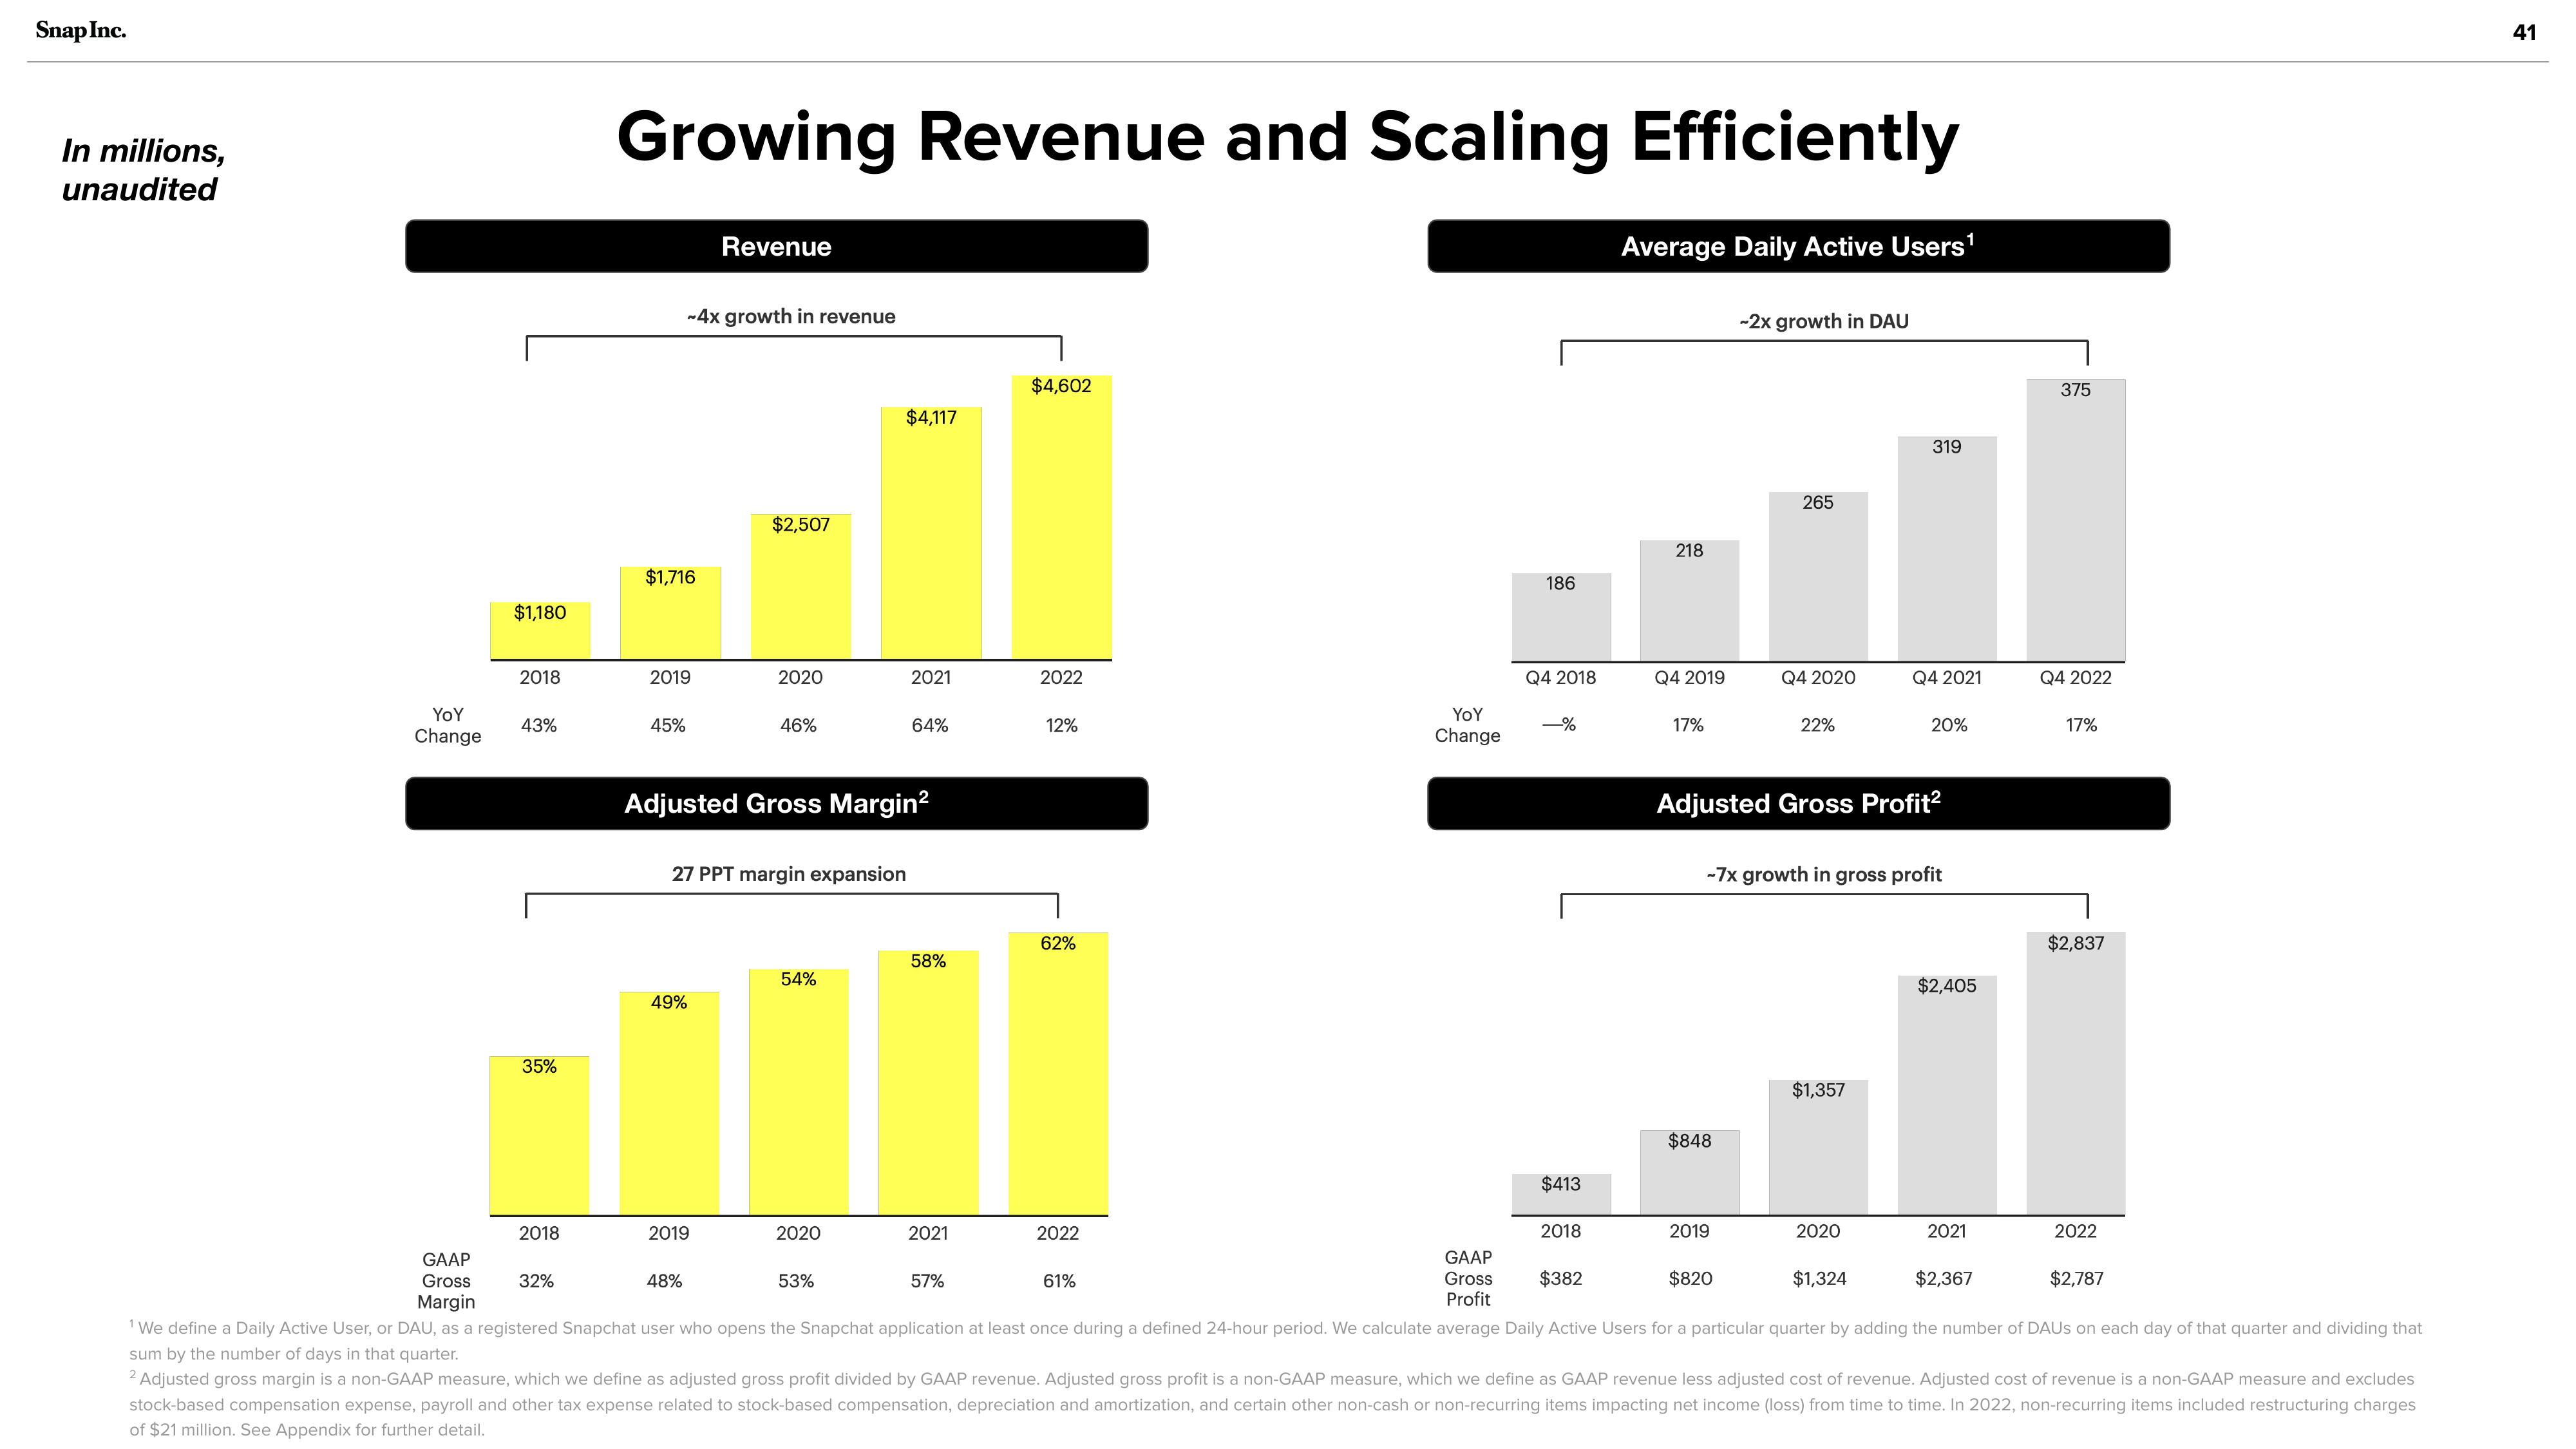
Growing Revenue and Scaling Efficiently
32%
$1,716
2019
45%
-4x growth in revenue
49%
Revenue
2019
$2,507
48%
2020
46%
27 PPT margin expansion
Adjusted Gross Margin²
54%
$4,117
2020
2021
53%
64%
58%
2021
$4,602
57%
2022
12%
62%
2022
YoY
Change
61%
186
Q4 2018
-%
$413
2018
Average Daily Active Users¹
218
Q4 2019
17%
$848
-2x growth in DAU
2019
265
Q4 2020
$820
22%
Adjusted Gross Profit²
-7x growth in gross profit
$1,357
319
2020
Q4 2021
20%
$1,324
$2,405
GAAP
$382
$2,787
Gross
Profit
GAAP
Gross
Margin
¹ We define a Daily Active User, or DAU, as a registered Snapchat user who opens the Snapchat application at least once during a defined 24-hour period. We calculate average Daily Active Users for a particular quarter by adding the number of DAUS on each day of that quarter and dividing that
sum by the number of days in that quarter.
2 Adjusted gross margin is a non-GAAP measure, which we define as adjusted gross profit divided by GAAP revenue. Adjusted gross profit is a non-GAAP measure, which we define as GAAP revenue less adjusted cost of revenue. Adjusted cost of revenue is a non-GAAP measure and excludes
stock-based compensation expense, payroll and other tax expense related to stock-based compensation, depreciation and amortization, and certain other non-cash or non-recurring items impacting net income (loss) from time to time. In 2022, non-recurring items included restructuring charges
of $21 million. See Appendix for further detail.
2021
375
$2,367
Q4 2022
17%
$2,837
2022
41View entire presentation