Telia Company Results Presentation Deck
FULL YEAR 2019 OPEX TARGET REALIZED
OPEX DEVELOPMENT
External expenses, like for like, including an estimated 2% cost inflation
2%
0%
-2%
-4%
-6%
●
Q4 18 Q1 19 Q2 19 Q3 19
●
T
-5%
Q4 19
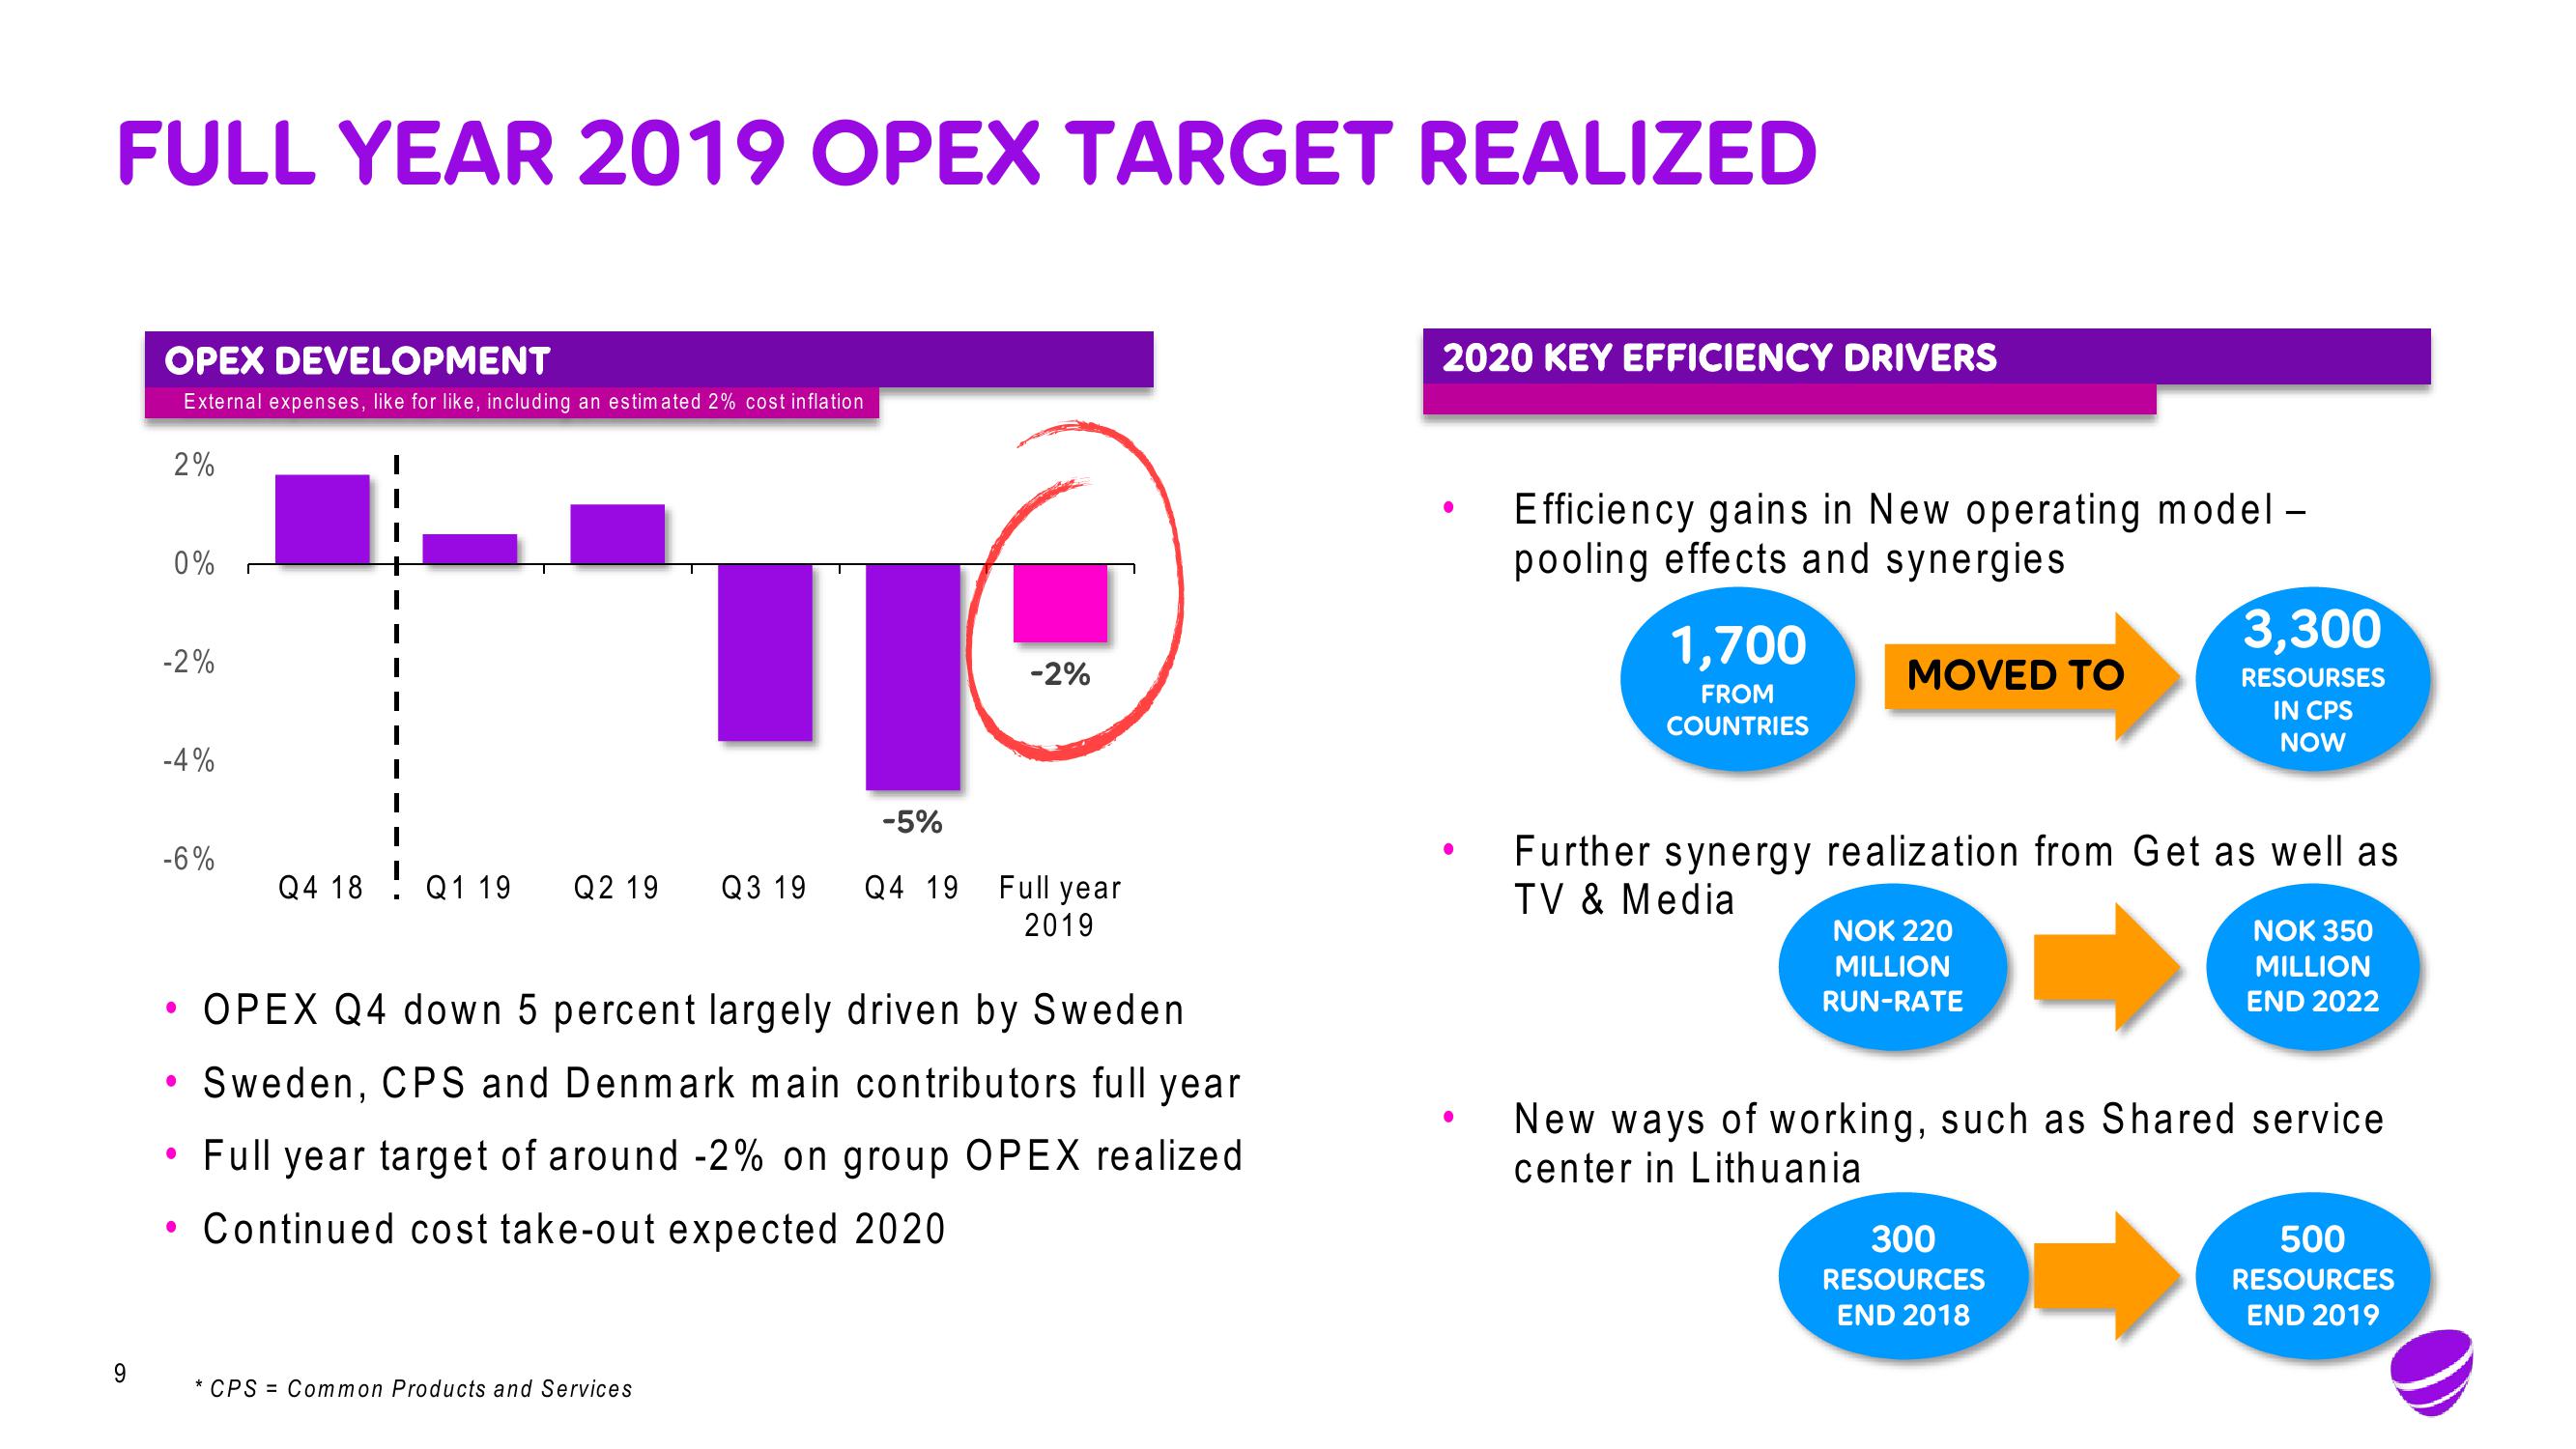
OPEX Q4 down 5 percent largely driven by Sweden
• Sweden, CPS and Denmark main contributors full year
●
* CPS = Common Products and Services
-2%
Full year
2019
• Full year target of around -2% on group OPEX realized
Continued cost take-out expected 2020
2020 KEY EFFICIENCY DRIVERS
●
Efficiency gains in New operating model -
pooling effects and synergies
1,700
FROM
COUNTRIES
MOVED TO
Further synergy realization from Get as well as
TV & Media
NOK 220
MILLION
RUN-RATE
3,300
RESOURSES
IN CPS
NOW
300
RESOURCES
END 2018
NOK 350
MILLION
END 2022
New ways of working, such as Shared service
center in Lithuania
500
RESOURCES
END 2019View entire presentation