DraftKings Investor Day Presentation Deck
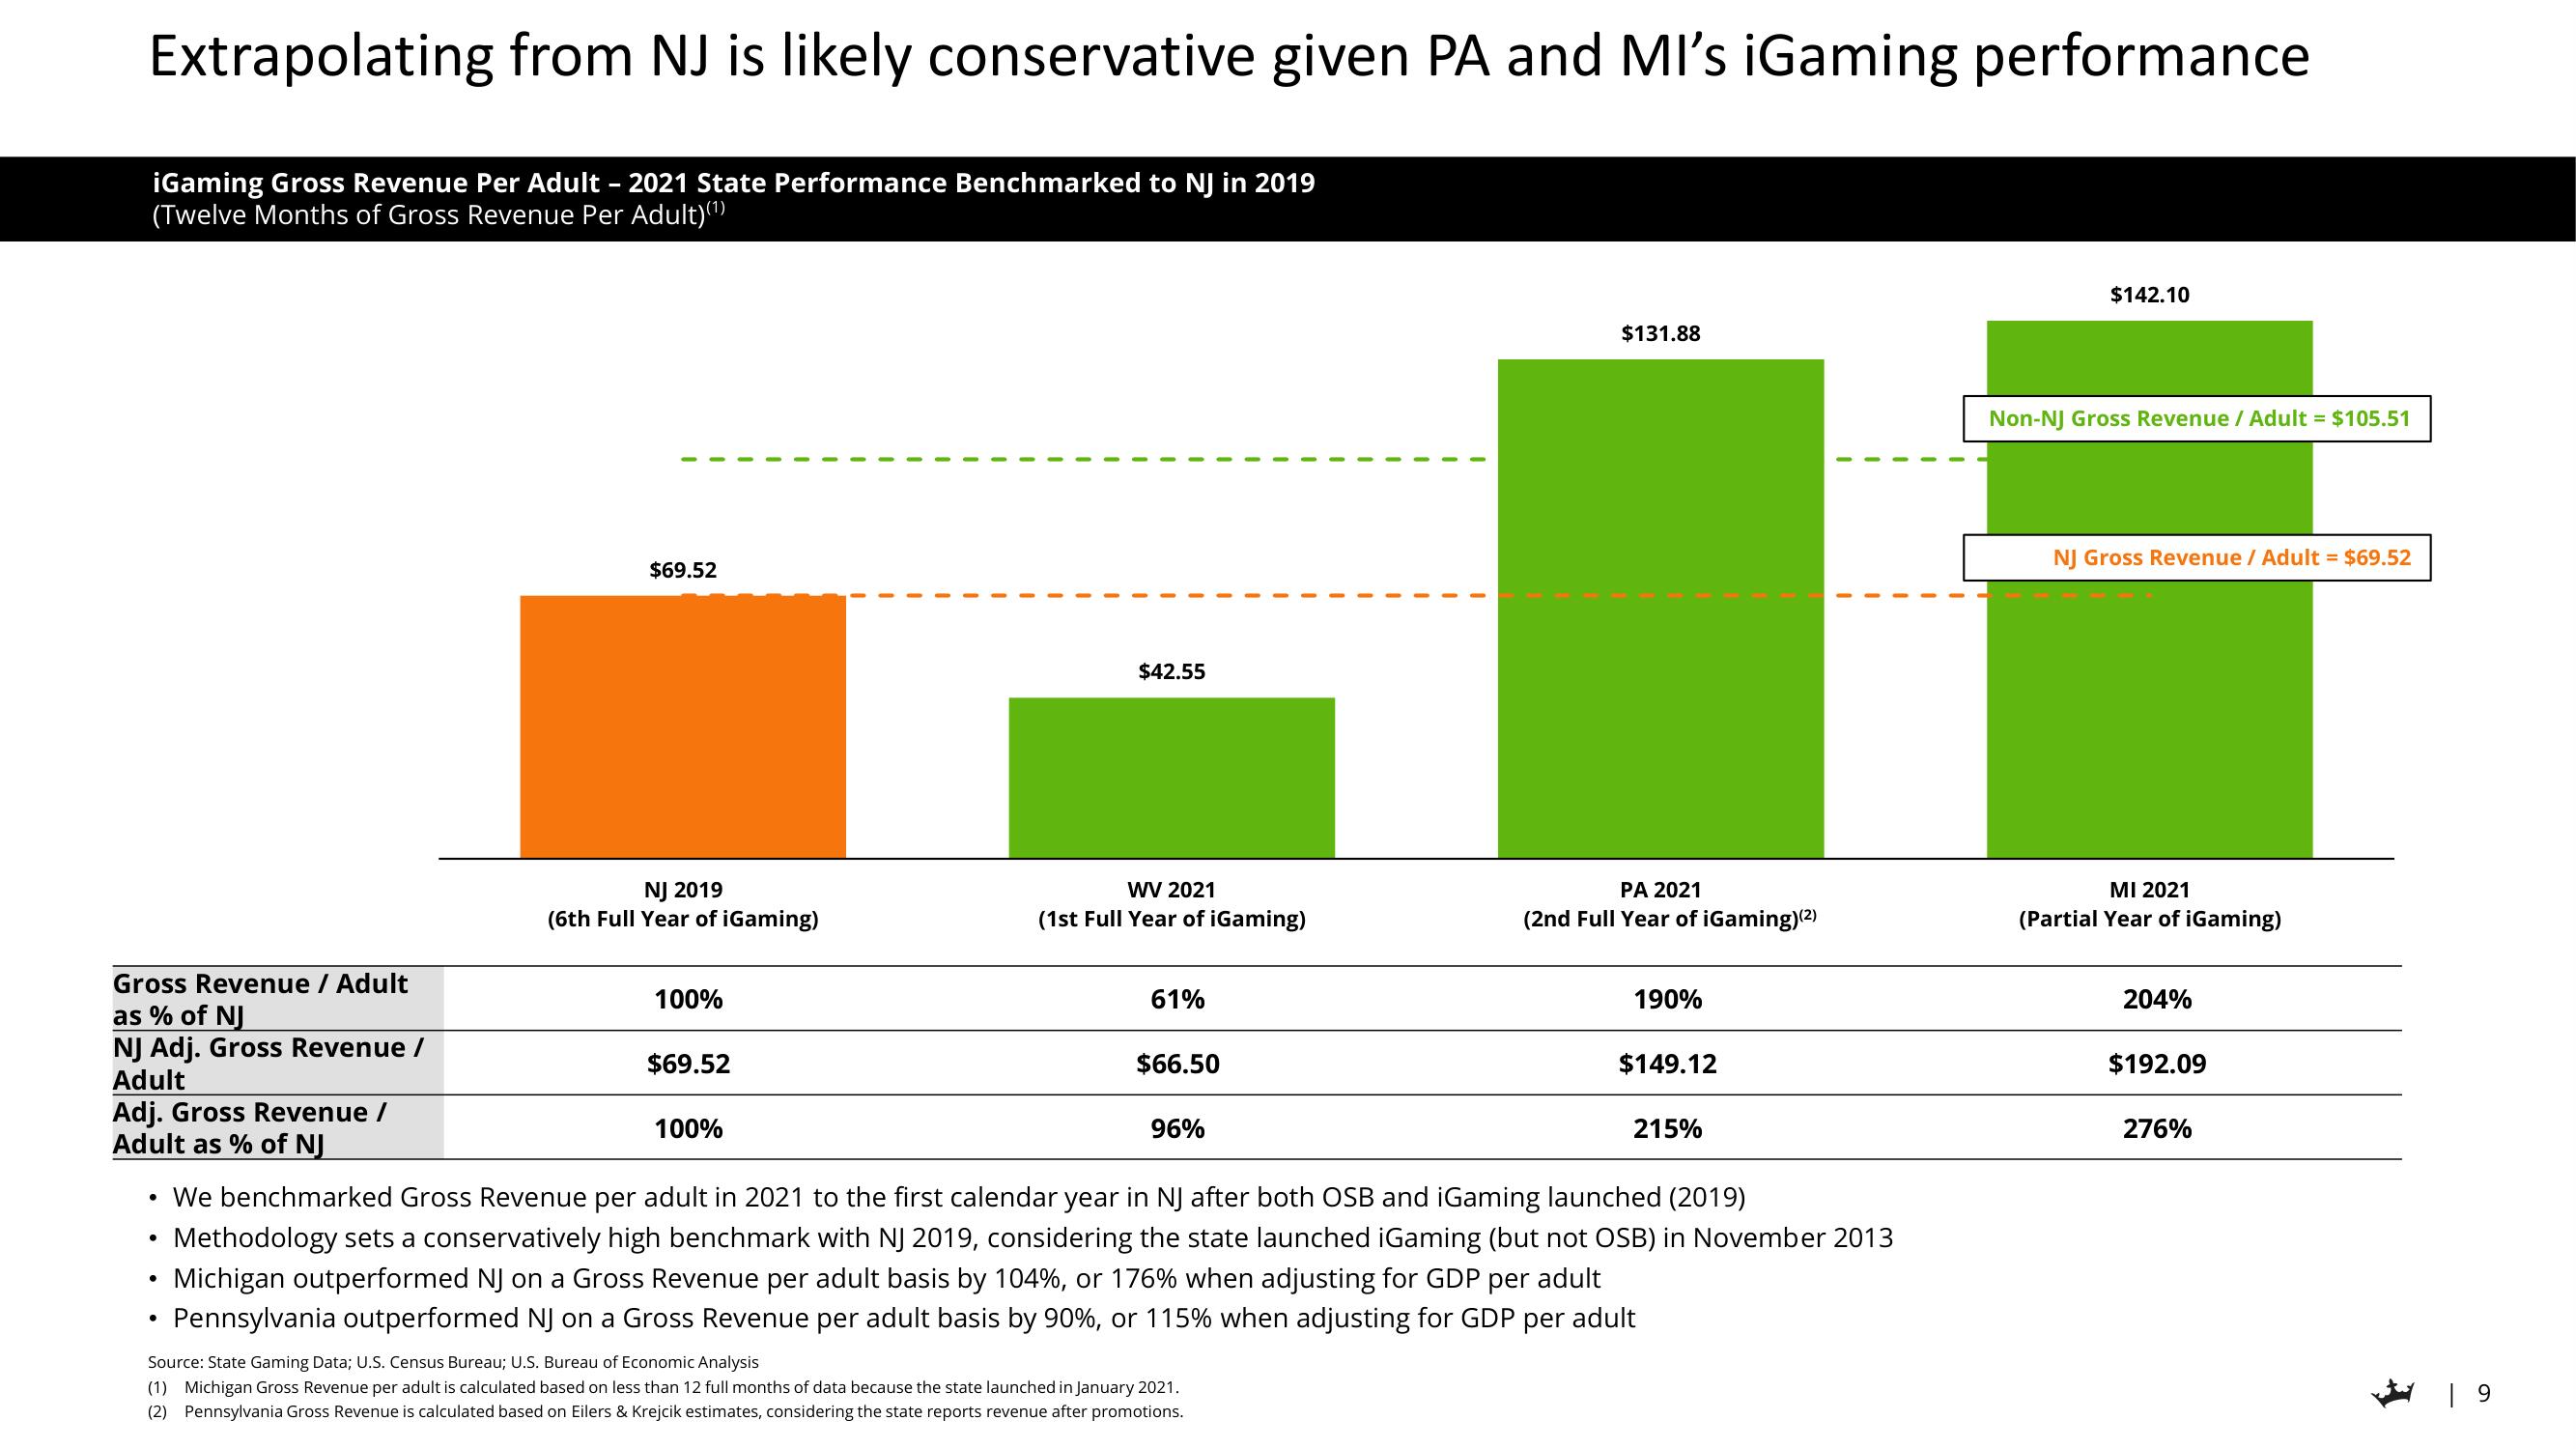
Extrapolating from NJ is likely conservative given PA and MI's iGaming performance
iGaming Gross Revenue Per Adult - 2021 State Performance Benchmarked to NJ in 2019
(Twelve Months of Gross Revenue Per Adult)(¹)
Gross Revenue / Adult
as % of NJ
NJ Adj. Gross Revenue /
Adult
Adj. Gross Revenue /
Adult as % of NJ
●
●
●
●
$69.52
NJ 2019
(6th Full Year of iGaming)
100%
$69.52
100%
$42.55
WV 2021
(1st Full Year of iGaming)
61%
$66.50
96%
$131.88
Source: State Gaming Data; U.S. Census Bureau; U.S. Bureau of Economic Analysis
(1) Michigan Gross Revenue per adult is calculated based on less than 12 full months of data because the state launched in January 2021.
(2) Pennsylvania Gross Revenue is calculated based on Eilers & Krejcik estimates, considering the state reports revenue after promotions.
PA 2021
(2nd Full Year of iGaming)(²)
190%
$149.12
215%
We benchmarked Gross Revenue per adult in 2021 to the first calendar year in NJ after both OSB and iGaming launched (2019)
Methodology sets a conservatively high benchmark with NJ 2019, considering the state launched iGaming (but not OSB) in November 2013
Michigan outperformed NJ on a Gross Revenue per adult basis by 104%, or 176% when adjusting for GDP per adult
Pennsylvania outperformed NJ on a Gross Revenue per adult basis by 90%, or 115% when adjusting for GDP per adult
$142.10
Non-NJ Gross Revenue / Adult = $105.51
NJ Gross Revenue / Adult = $69.52
MI 2021
(Partial Year of iGaming)
204%
$192.09
276%
| 9View entire presentation