Telia Company Results Presentation Deck
Sweden financials
*
Service revenues
Reported currency, in SEK millions, like for like growth
7,336
Q2 21
7,337
Q3 21
■Consumer
+1.2%
7,677
Q4 21
7,380
Q1 22
■ Enterprise
7,446
Q2 22
Copper legacy = fixed telephony and xDSL
■ Other
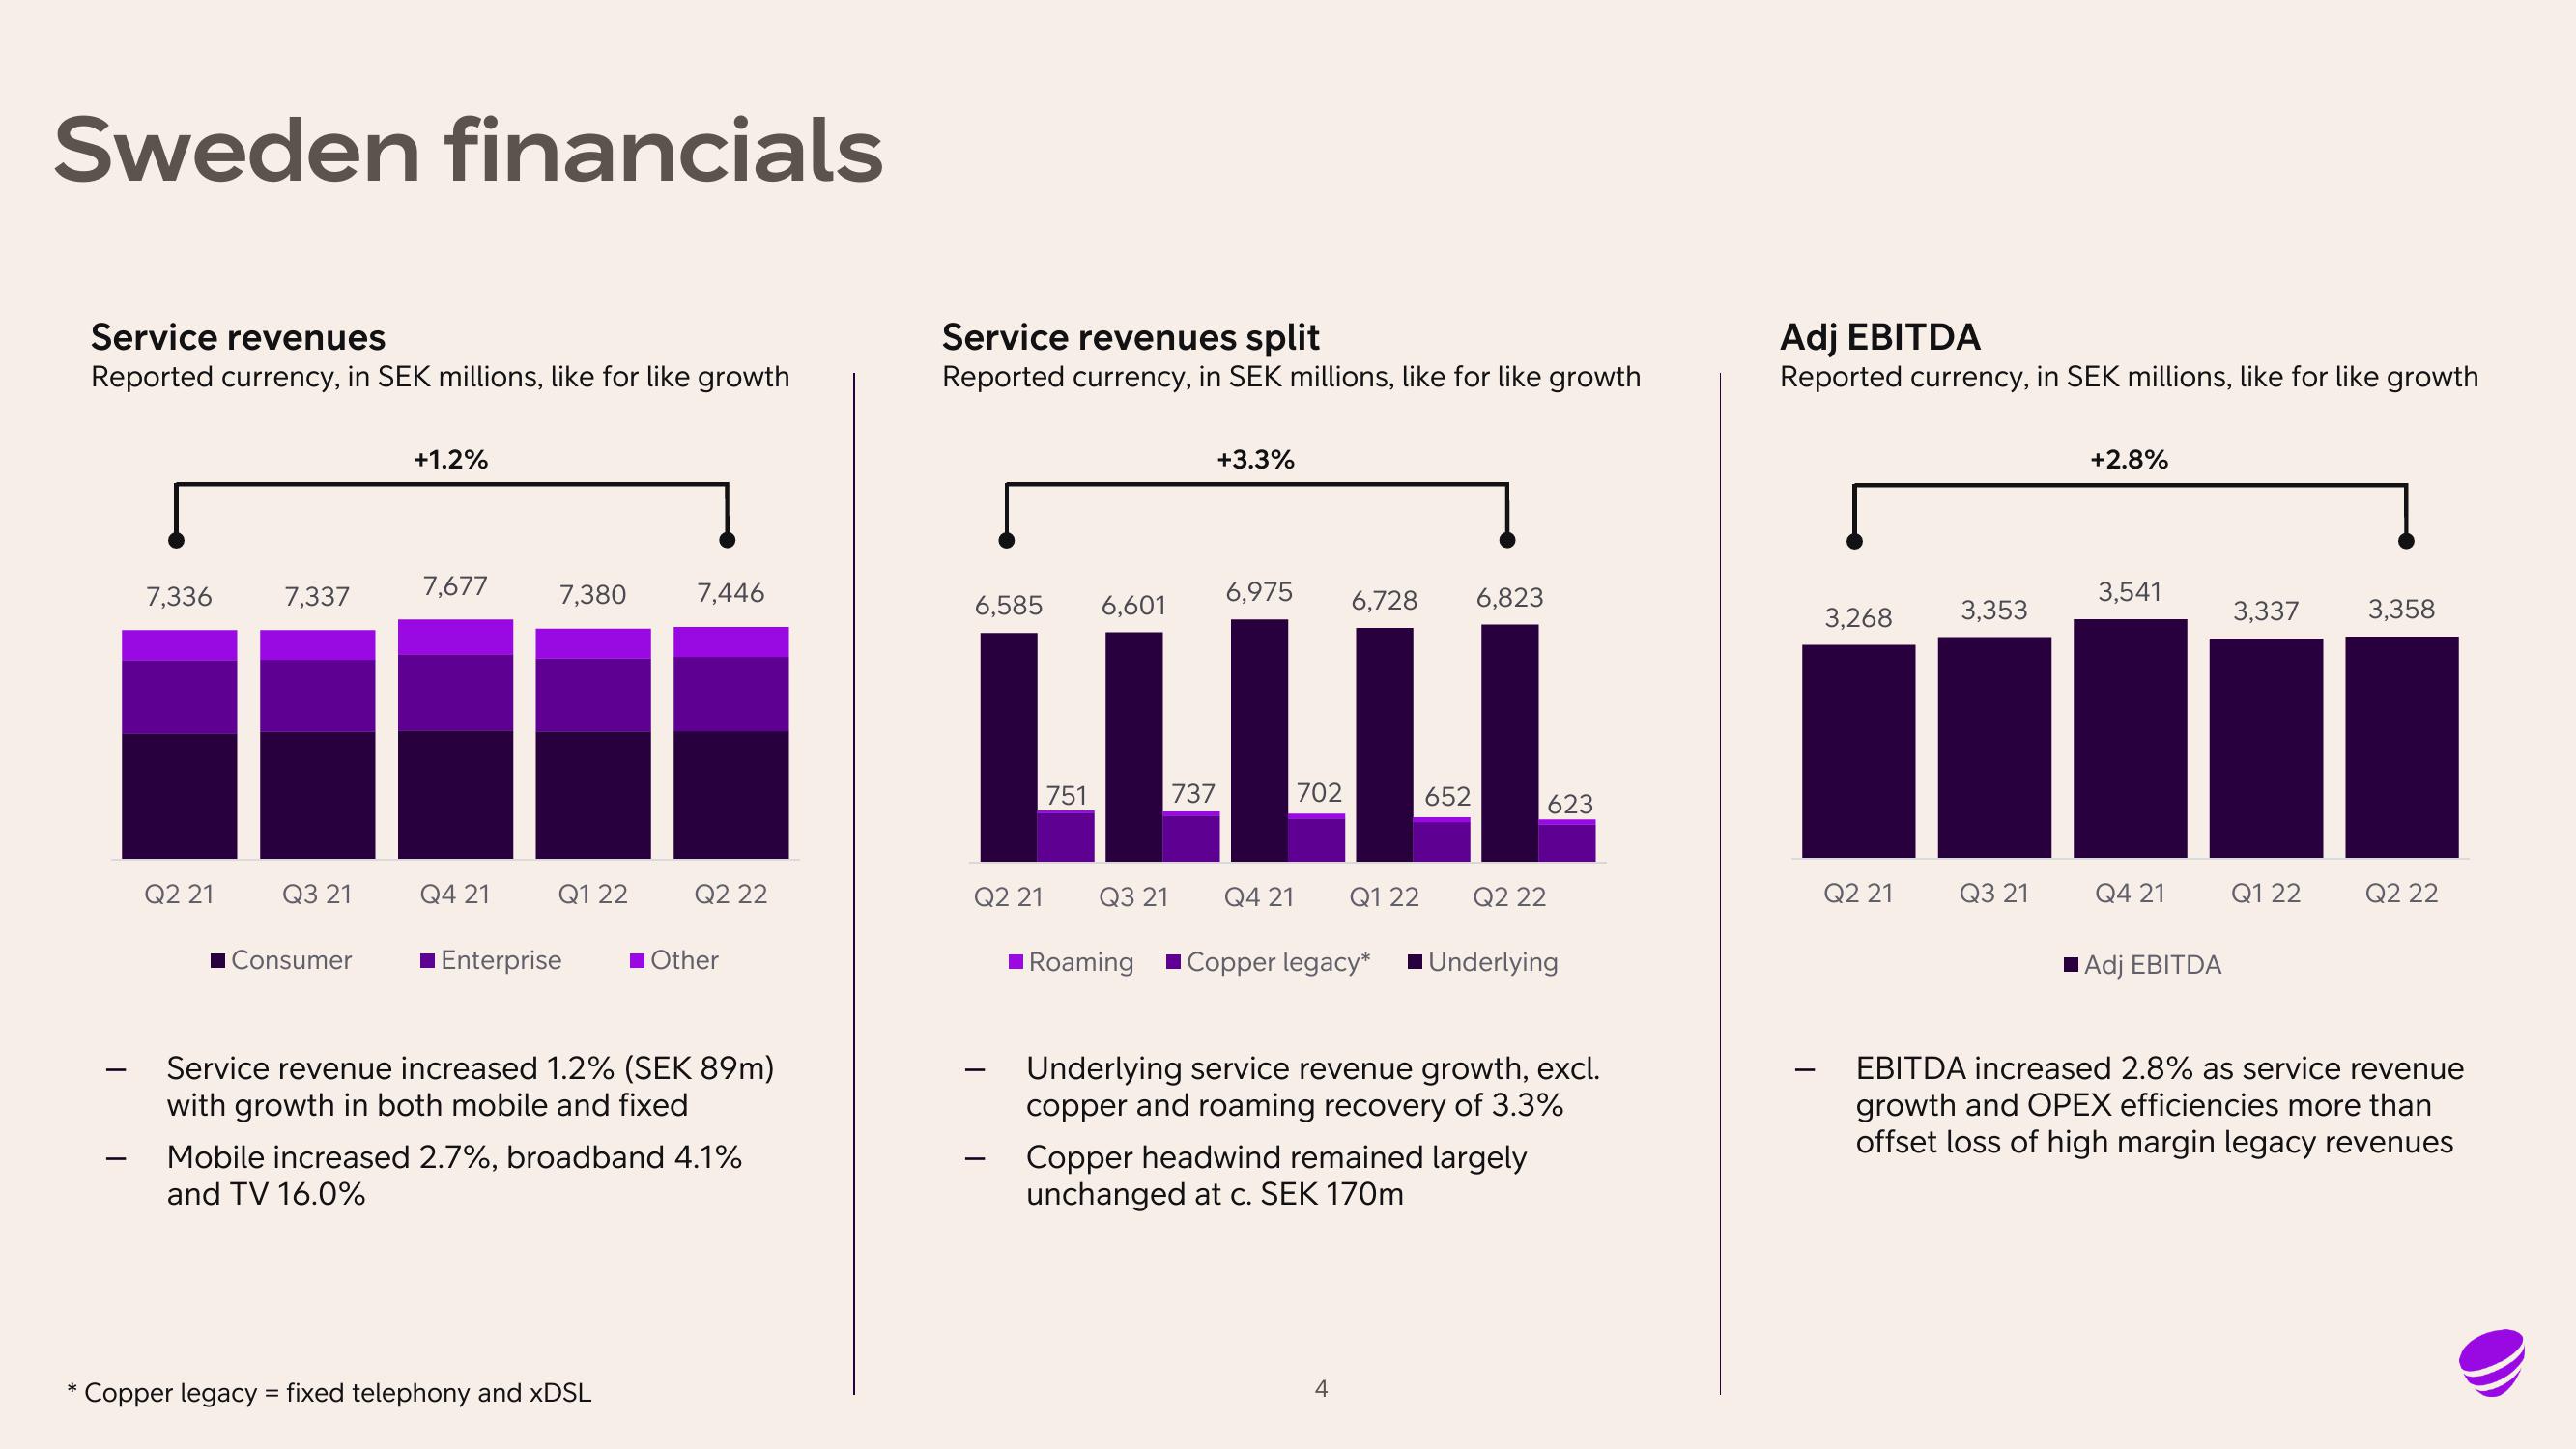
Service revenue increased 1.2% (SEK 89m)
with growth in both mobile and fixed
Mobile increased 2.7%, broadband 4.1%
and TV 16.0%
Service revenues split
Reported currency, in SEK millions, like for like growth
6,975
LLLLL
Q4 21
6,585 6,601
Q2 21
Q3 21
+3.3%
■Roaming
6,728
Q1 22
4
6,823
623
Q2 22
Copper legacy* ■Underlying
Underlying service revenue growth, excl.
copper and roaming recovery of 3.3%
Copper headwind remained largely
unchanged at c. SEK 170m
Adj EBITDA
Reported currency, in SEK millions, like for like growth
3,268
Q2 21
3,353
Q3 21
+2.8%
3,541
Q4 21
Adj EBITDA
3,337
Q1 22
3,358
Q2 22
EBITDA increased 2.8% as service revenue
growth and OPEX efficiencies more than
offset loss of high margin legacy revenuesView entire presentation