jetBlue Results Presentation Deck
Outlook Summary
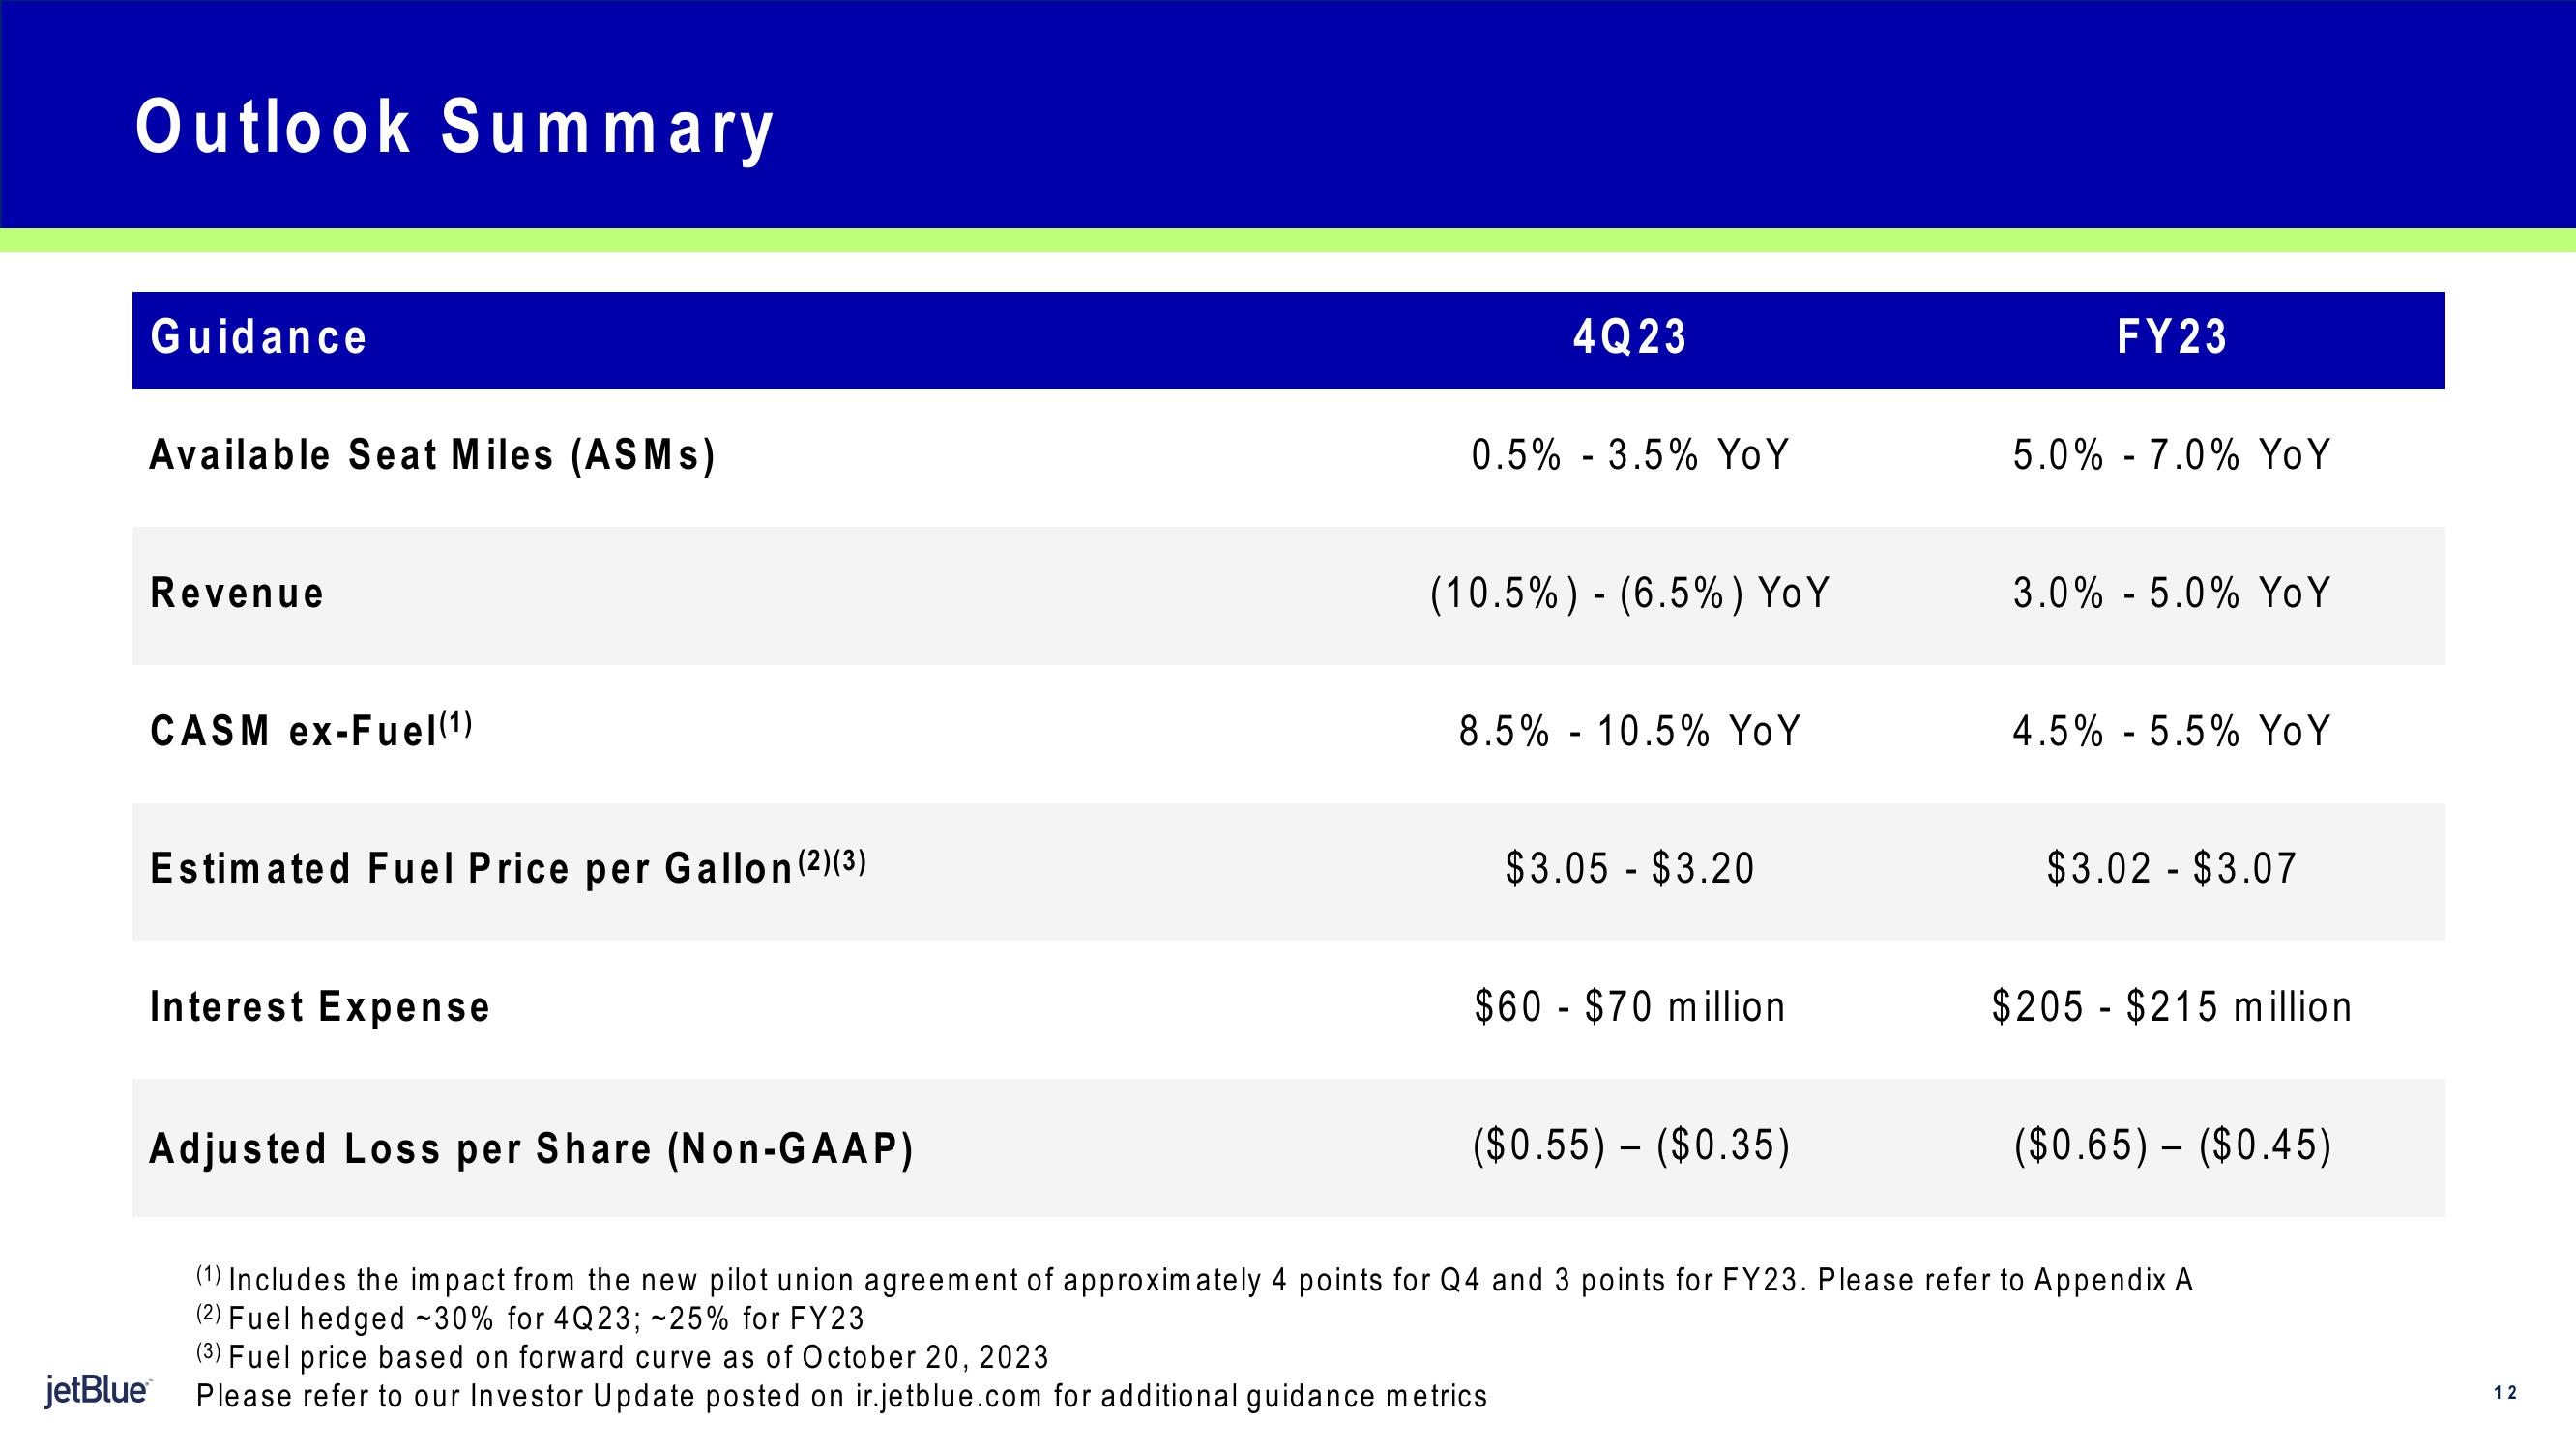
Guidance
Available Seat Miles (ASMS)
Revenue
CASM ex-Fuel (¹)
Estimated Fuel Price per Gallon (2) (3)
Interest Expense
Adjusted Loss per Share (Non-GAAP)
4Q23
0.5% 3.5% YoY
-
(10.5%) (6.5%) YoY
-
8.5% -10.5% YoY
$3.05 - $3.20
$60 $70 million
($0.55) - ($0.35)
FY23
5.0% - 7.0% YoY
3.0% 5.0% YoY
-
4.5% 5.5% YoY
-
$3.02 - $3.07
$205 $215 million
($0.65) ($0.45)
-
(1) Includes the impact from the new pilot union agreement of approximately 4 points for Q4 and 3 points for FY23. Please refer to Appendix A
(2) Fuel hedged -30% for 4Q23; -25% for FY23
(3) Fuel price based on forward curve as of October 20, 2023
jetBlue Please refer to our Investor Update posted on ir.jetblue.com for additional guidance metrics
12View entire presentation