Second Quarter 2017 Conference Call
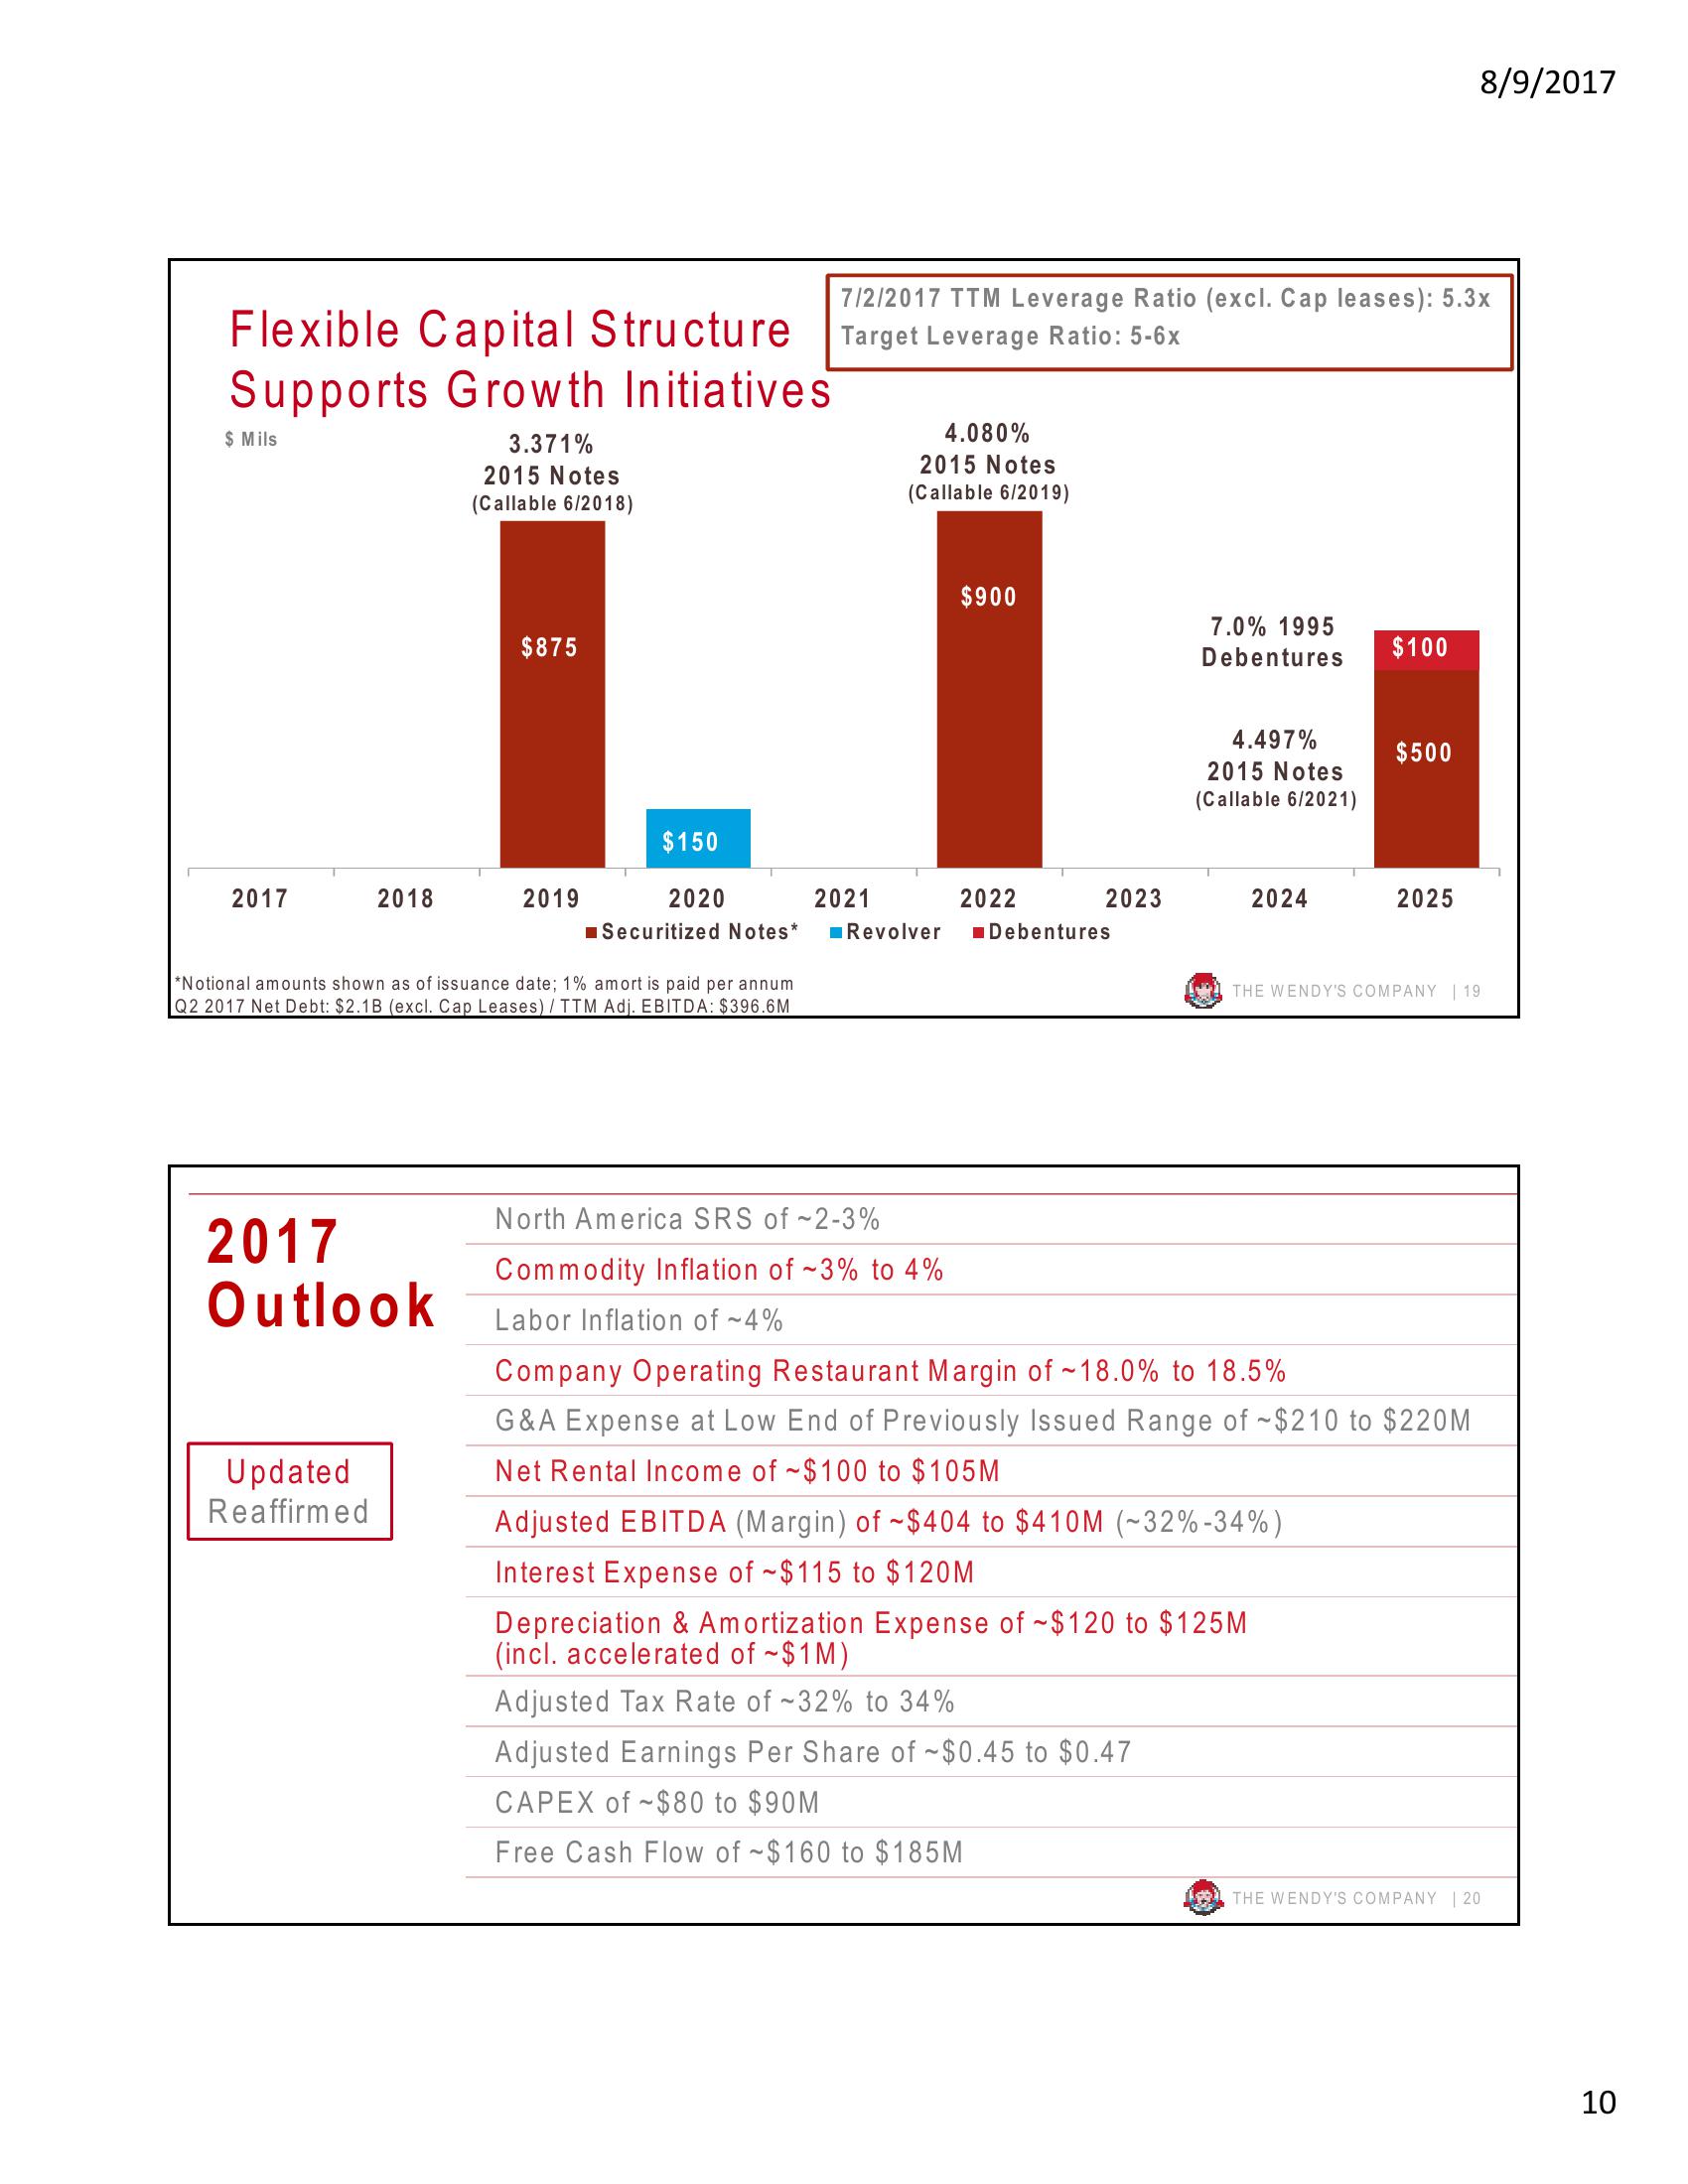
Flexible Capital Structure
Supports Growth Initiatives
3.371%
2015 Notes
(Callable 6/2018)
$ Mils
2017
2018
2017
Outlook
Updated
Reaffirmed
$875
2019
*Notional amounts shown as of issuance date; 1% amort is paid per annum
Q2 2017 Net Debt: $2.1B (excl. Cap Leases) / TTM Adj. EBITDA: $396.6M
$150
2020
■ Securitized Notes*
7/2/2017 TTM Leverage Ratio (excl. Cap leases): 5.3x
Target Leverage Ratio: 5-6x
2021
4.080%
2015 Notes
(Callable 6/2019)
$900
North America SRS of ~2-3%
Commodity Inflation of ~3% to 4%
Labor Inflation of ~4%
2022
2023
Revolver Debentures
7.0% 1995
Debentures
4.497%
2015 Notes
(Callable 6/2021)
2024
$100
$500
Adjusted EBITDA (Margin) of ~$404 to $410M (~32% -34%)
Interest Expense of ~$115 to $120M
Depreciation & Amortization Expense of ~$120 to $125M
(incl. accelerated of ~$1M)
Adjusted Tax Rate of -32% to 34%
Adjusted Earnings Per Share of ~$0.45 to $0.47
CAPEX of $80 to $90M
Free Cash Flow of $160 to $185M
2025
8/9/2017
THE WENDY'S COMPANY 19
Company Operating Restaurant Margin of ~18.0% to 18.5%
G&A Expense at Low End of Previously Issued Range of $210 to $220M
Net Rental Income of ~$100 to $105M
THE WENDY'S COMPANY | 20
10View entire presentation