Bed Bath & Beyond Results Presentation Deck
FISCAL 2022
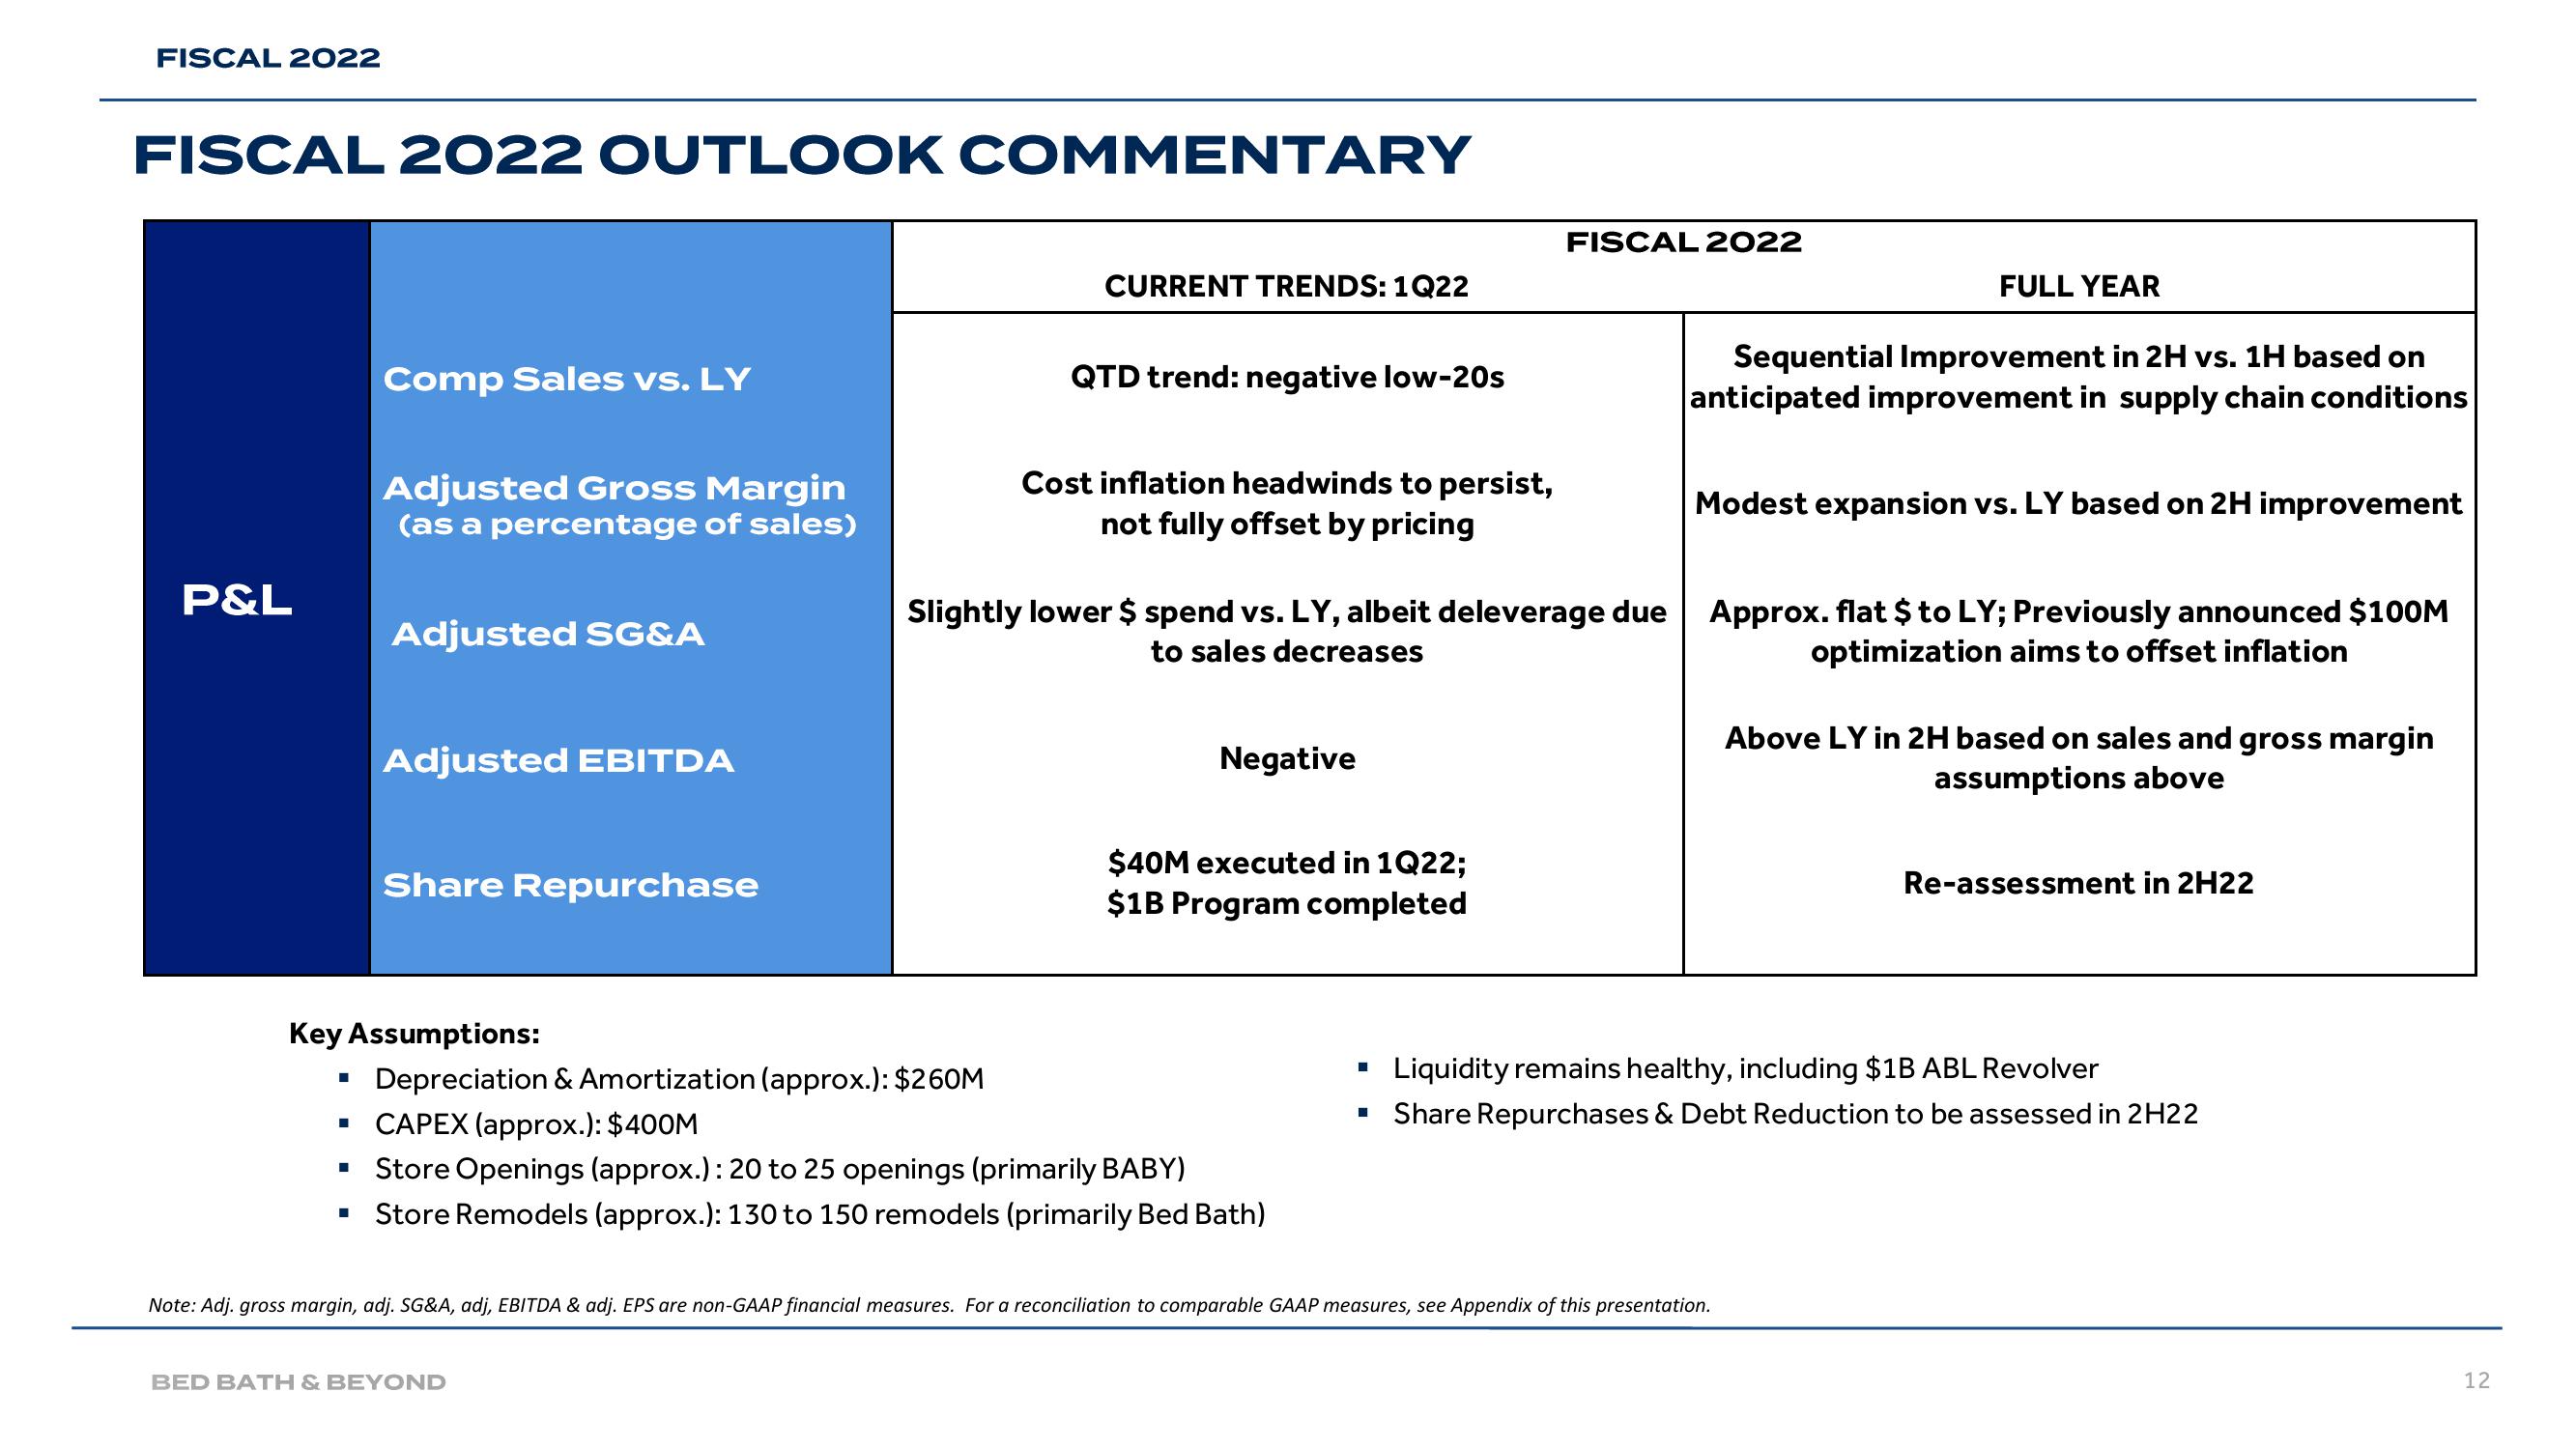
FISCAL 2022 OUTLOOK COMMENTARY
P&L
Comp Sales vs. LY
■
Adjusted Gross Margin
(as a percentage of sales)
■
Adjusted SG&A
Adjusted EBITDA
Key Assumptions:
Share Repurchase
CURRENT TRENDS: 1Q22
QTD trend: negative low-20s
BED BATH & BEYOND
Cost inflation headwinds to persist,
not fully offset by pricing
Depreciation & Amortization (approx.): $260M
▪ CAPEX (approx.): $400M
▪ Store Openings (approx.): 20 to 25 openings (primarily BABY)
Store Remodels (approx.): 130 to 150 remodels (primarily Bed Bath)
Slightly lower $ spend vs. LY, albeit deleverage due
to sales decreases
Negative
$40M executed in 1Q22;
$1B Program completed
I
FISCAL 2022
■
FULL YEAR
Sequential Improvement in 2H vs. 1H based on
anticipated improvement in supply chain conditions
Modest expansion vs. LY based on 2H improvement
Approx. flat $ to LY; Previously announced $100M
optimization aims to offset inflation
Note: Adj. gross margin, adj. SG&A, adj, EBITDA & adj. EPS are non-GAAP financial measures. For a reconciliation to comparable GAAP measures, see Appendix of this presentation.
Above LY in 2H based on sales and gross margin
assumptions above
Re-assessment in 2H22
Liquidity remains healthy, including $1B ABL Revolver
Share Repurchases & Debt Reduction to be assessed in 2H22
12View entire presentation