OppFi Investor Presentation Deck
FGNA Investment Thesis
19
1
2
3
Strong Management; #1 Priority
Our Philosophy: Long-Term Partnership
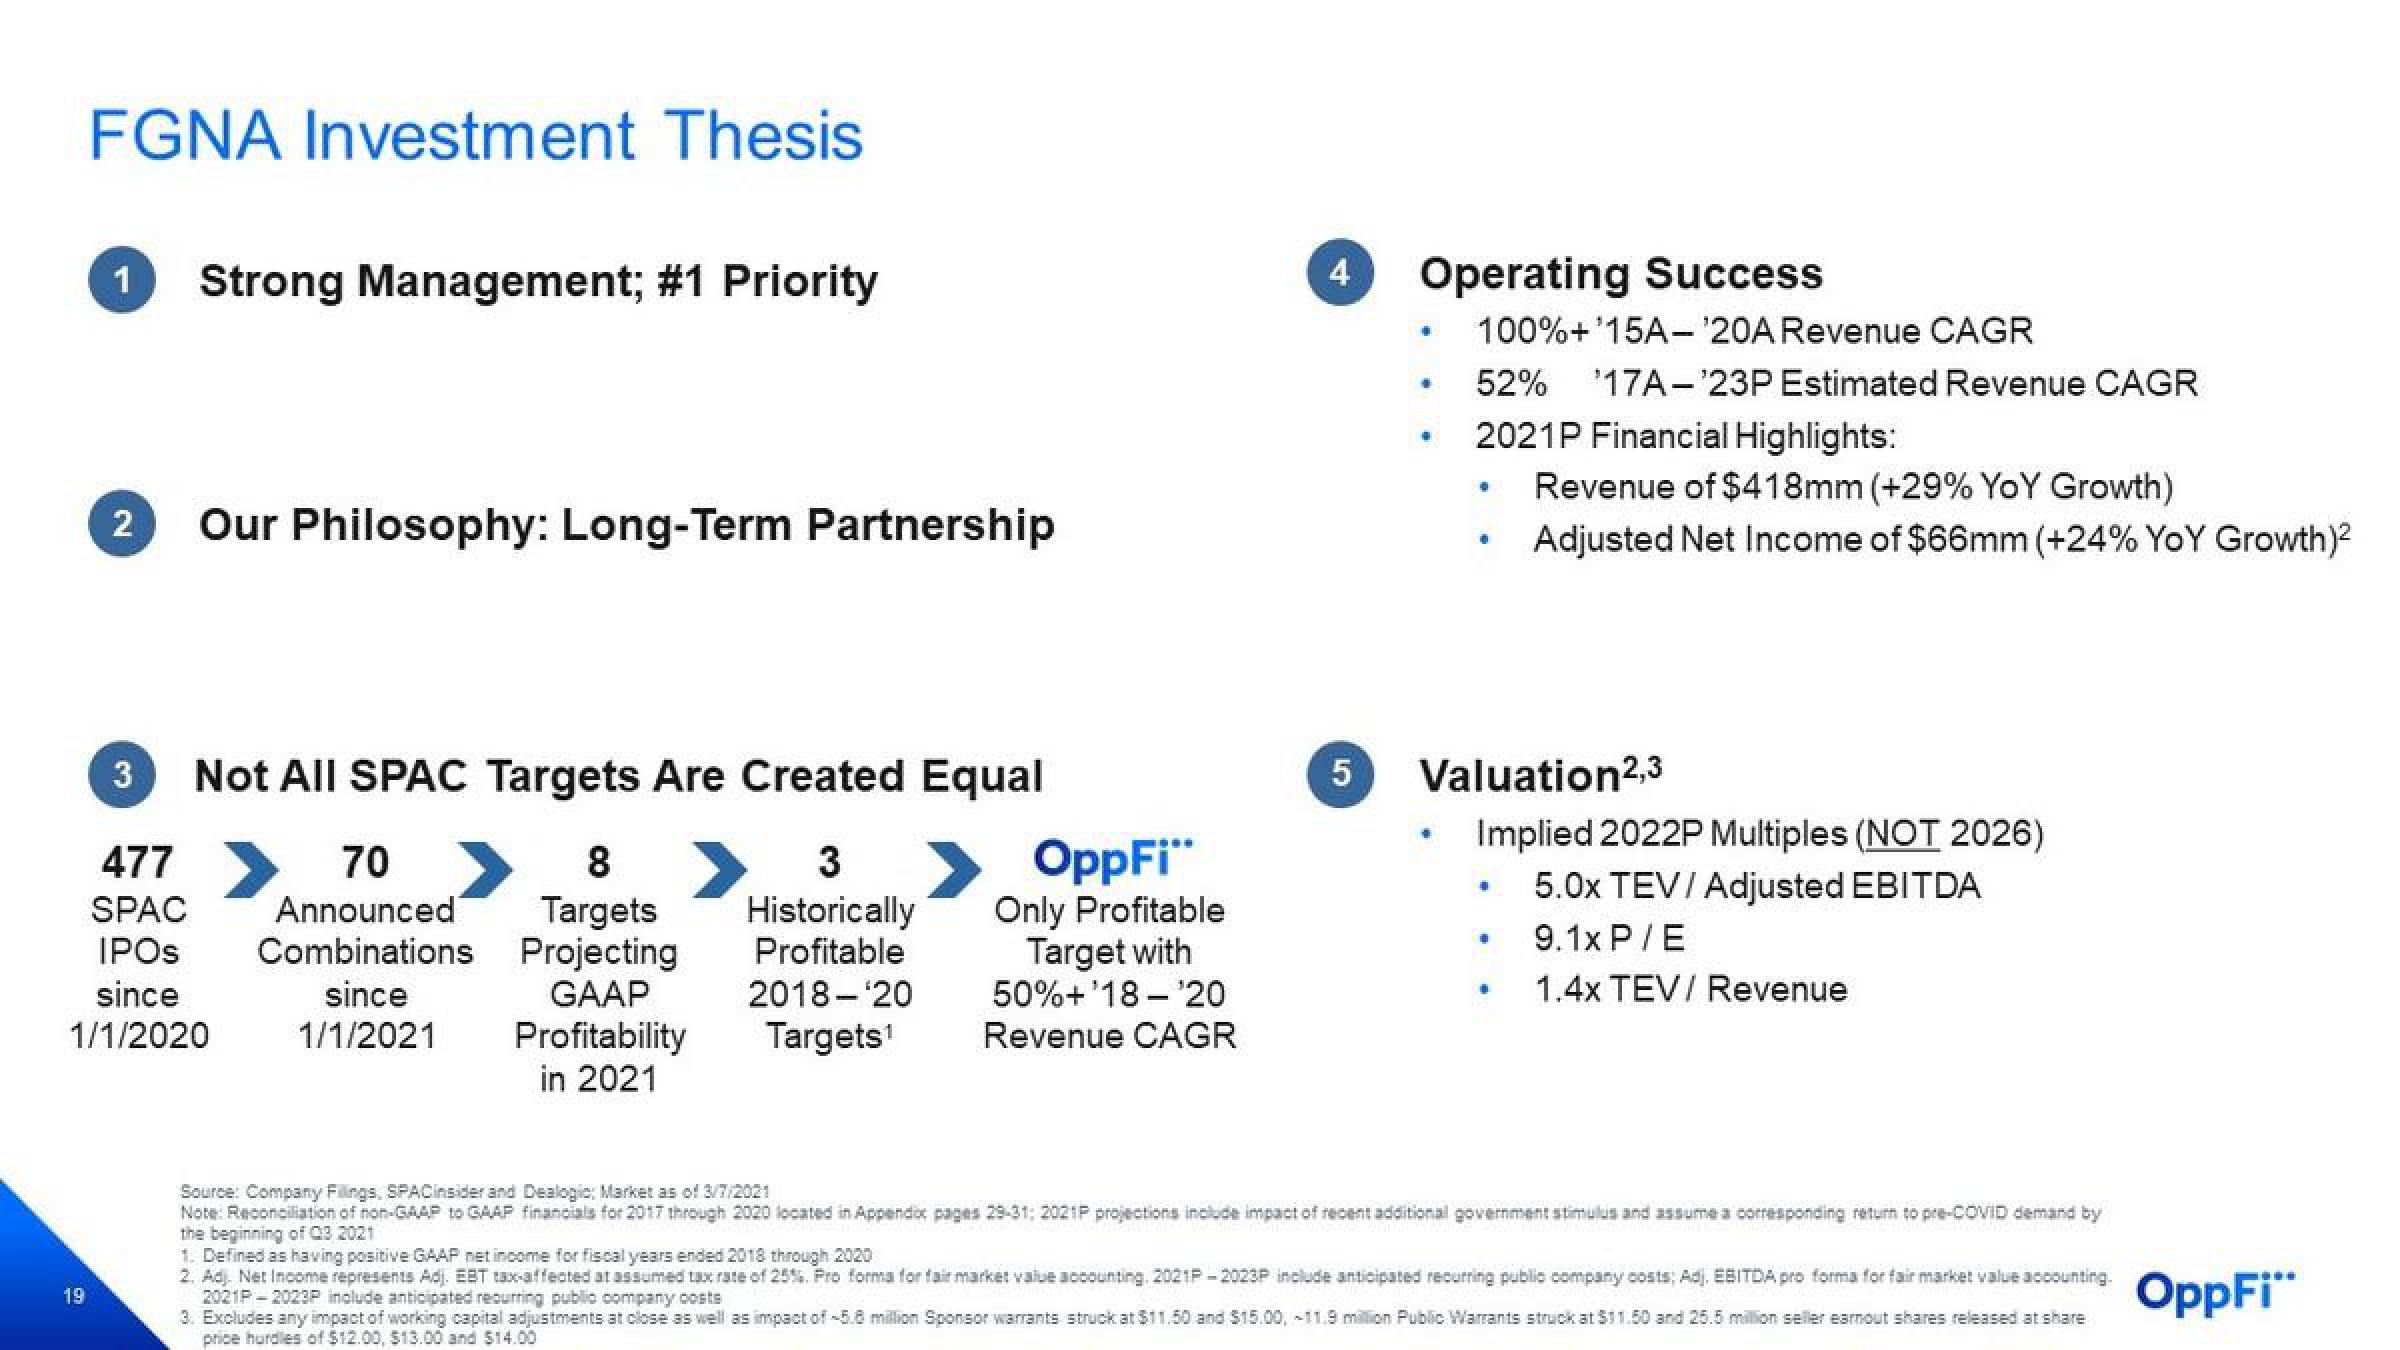
Not All SPAC Targets Are Created Equal
3
Historically
Profitable
2018-20
Profitability Targets¹
in 2021
477
8
70
SPAC Announced Targets
IPOS Combinations Projecting
since
GAAP
since
1/1/2021
1/1/2020
OppFi"
Only Profitable
Target with
50%+18-¹20
Revenue CAGR
4
5
Operating Success
·
100%+¹15A-¹20A Revenue CAGR
52% '17A-¹23P Estimated Revenue CAGR
2021P Financial Highlights:
Revenue of $418mm (+29% YoY Growth)
Adjusted Net Income of $66mm (+24% YoY Growth)²
Valuation2,3
+
Implied 2022P Multiples (NOT 2026)
5.0x TEV/Adjusted EBITDA
9.1x P/E
1.4x TEV/ Revenue
Source: Company Fillings, SPACinsider and Dealogic Market as of 3/7/2021
Note: Reconciliation of non-GAAP to GAAP financials for 2017 through 2020 located in Appendix pages 29-31; 2021P projections include impact of recent additional government stimulus and assume a corresponding return to pre-COVID demand by
the beginning of 08 2021
1. Defined as having positive GAAP net income for fiscal years ended 2018 through 2020
2. Adj. Net Income represents Adj. EBT tax-affected at assumed tax rate of 25%. Pro forma for fair market value accounting, 2021P-2023P include anticipated recurring public company costs; Adj, EBITDA pro forma for fair market value accounting.
2021P-2023P include anticipated recurring public company costs
3. Excludes any impact of working capital adjustments at close as well as impact of -5.8 million Sponsor warrants struck at $11.50 and $15.00, -11.9 million Public Warrants struck at $11.50 and 25.5 million seller earnout shares released at share
price hurdles of $12.00, $13.00 and $14.00
OppFi"View entire presentation