jetBlue Results Presentation Deck
RESETTING 2022 PLAN TO BUILD BACK MARGINS
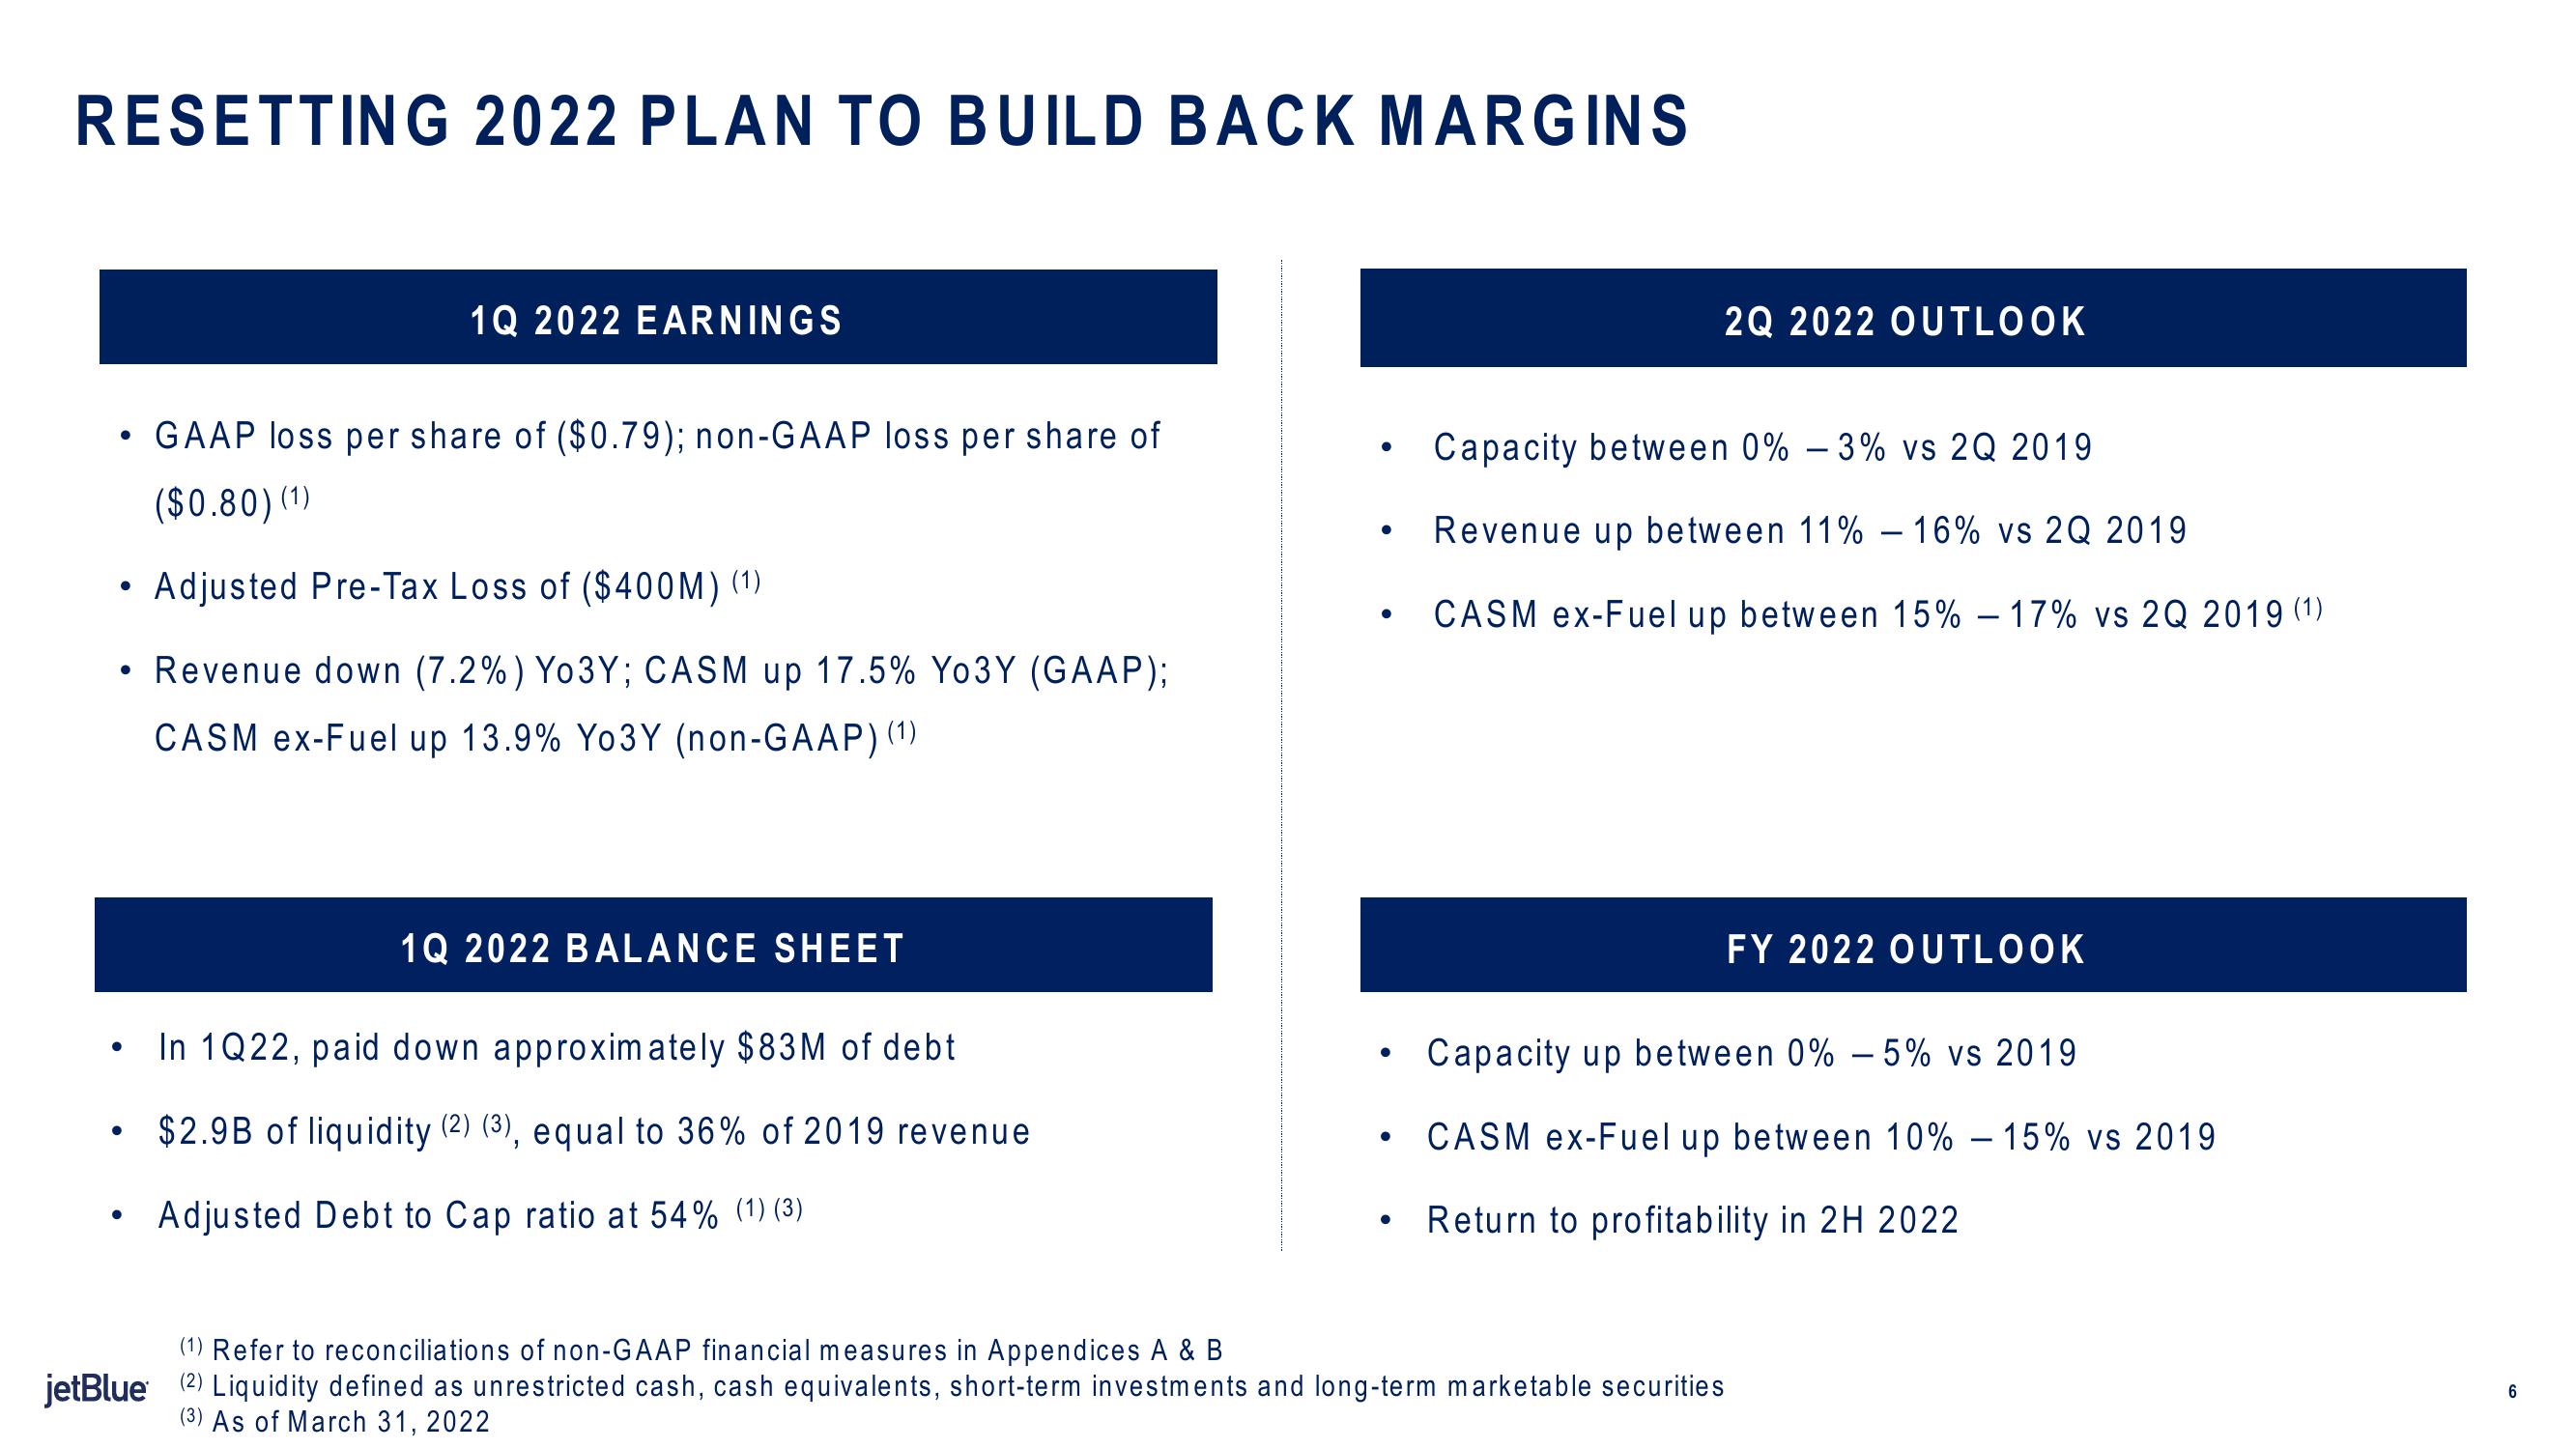
GAAP loss per share of ($0.79); non-GAAP loss per share of
($0.80) (1)
Adjusted Pre-Tax Loss of ($400M) (1)
• Revenue down (7.2%) Yo3Y; CASM up 17.5% Yo3Y (GAAP);
CASM ex-Fuel up 13.9% Yo3Y (non-GAAP) (1)
●
1Q 2022 EARNINGS
●
1Q 2022 BALANCE SHEET
In 1Q22, paid down approximately $83M of debt
$2.9B of liquidity (2) (3), equal to 36% of 2019 revenue
Adjusted Debt to Cap ratio at 54% (1) (3)
●
●
●
●
●
●
2Q 2022 OUTLOOK
Capacity between 0% -3% vs 2Q 2019
Revenue up between 11% -16% vs 2Q 2019
CASM ex-Fuel up between 15% -17% vs 2Q 2019 (1)
FY 2022 OUTLOOK
Capacity up between 0% - 5% vs 2019
CASM ex-Fuel up between 10% - 15% vs 2019
Return to profitability in 2H 2022
(1) Refer to reconciliations of non-GAAP financial measures in Appendices A & B
jetBlue (2) Liquidity defined as unrestricted cash, cash equivalents, short-term investments and long-term marketable securities
(3) As of March 31, 2022
6View entire presentation