First Quarter 2023 Earnings Conference Call
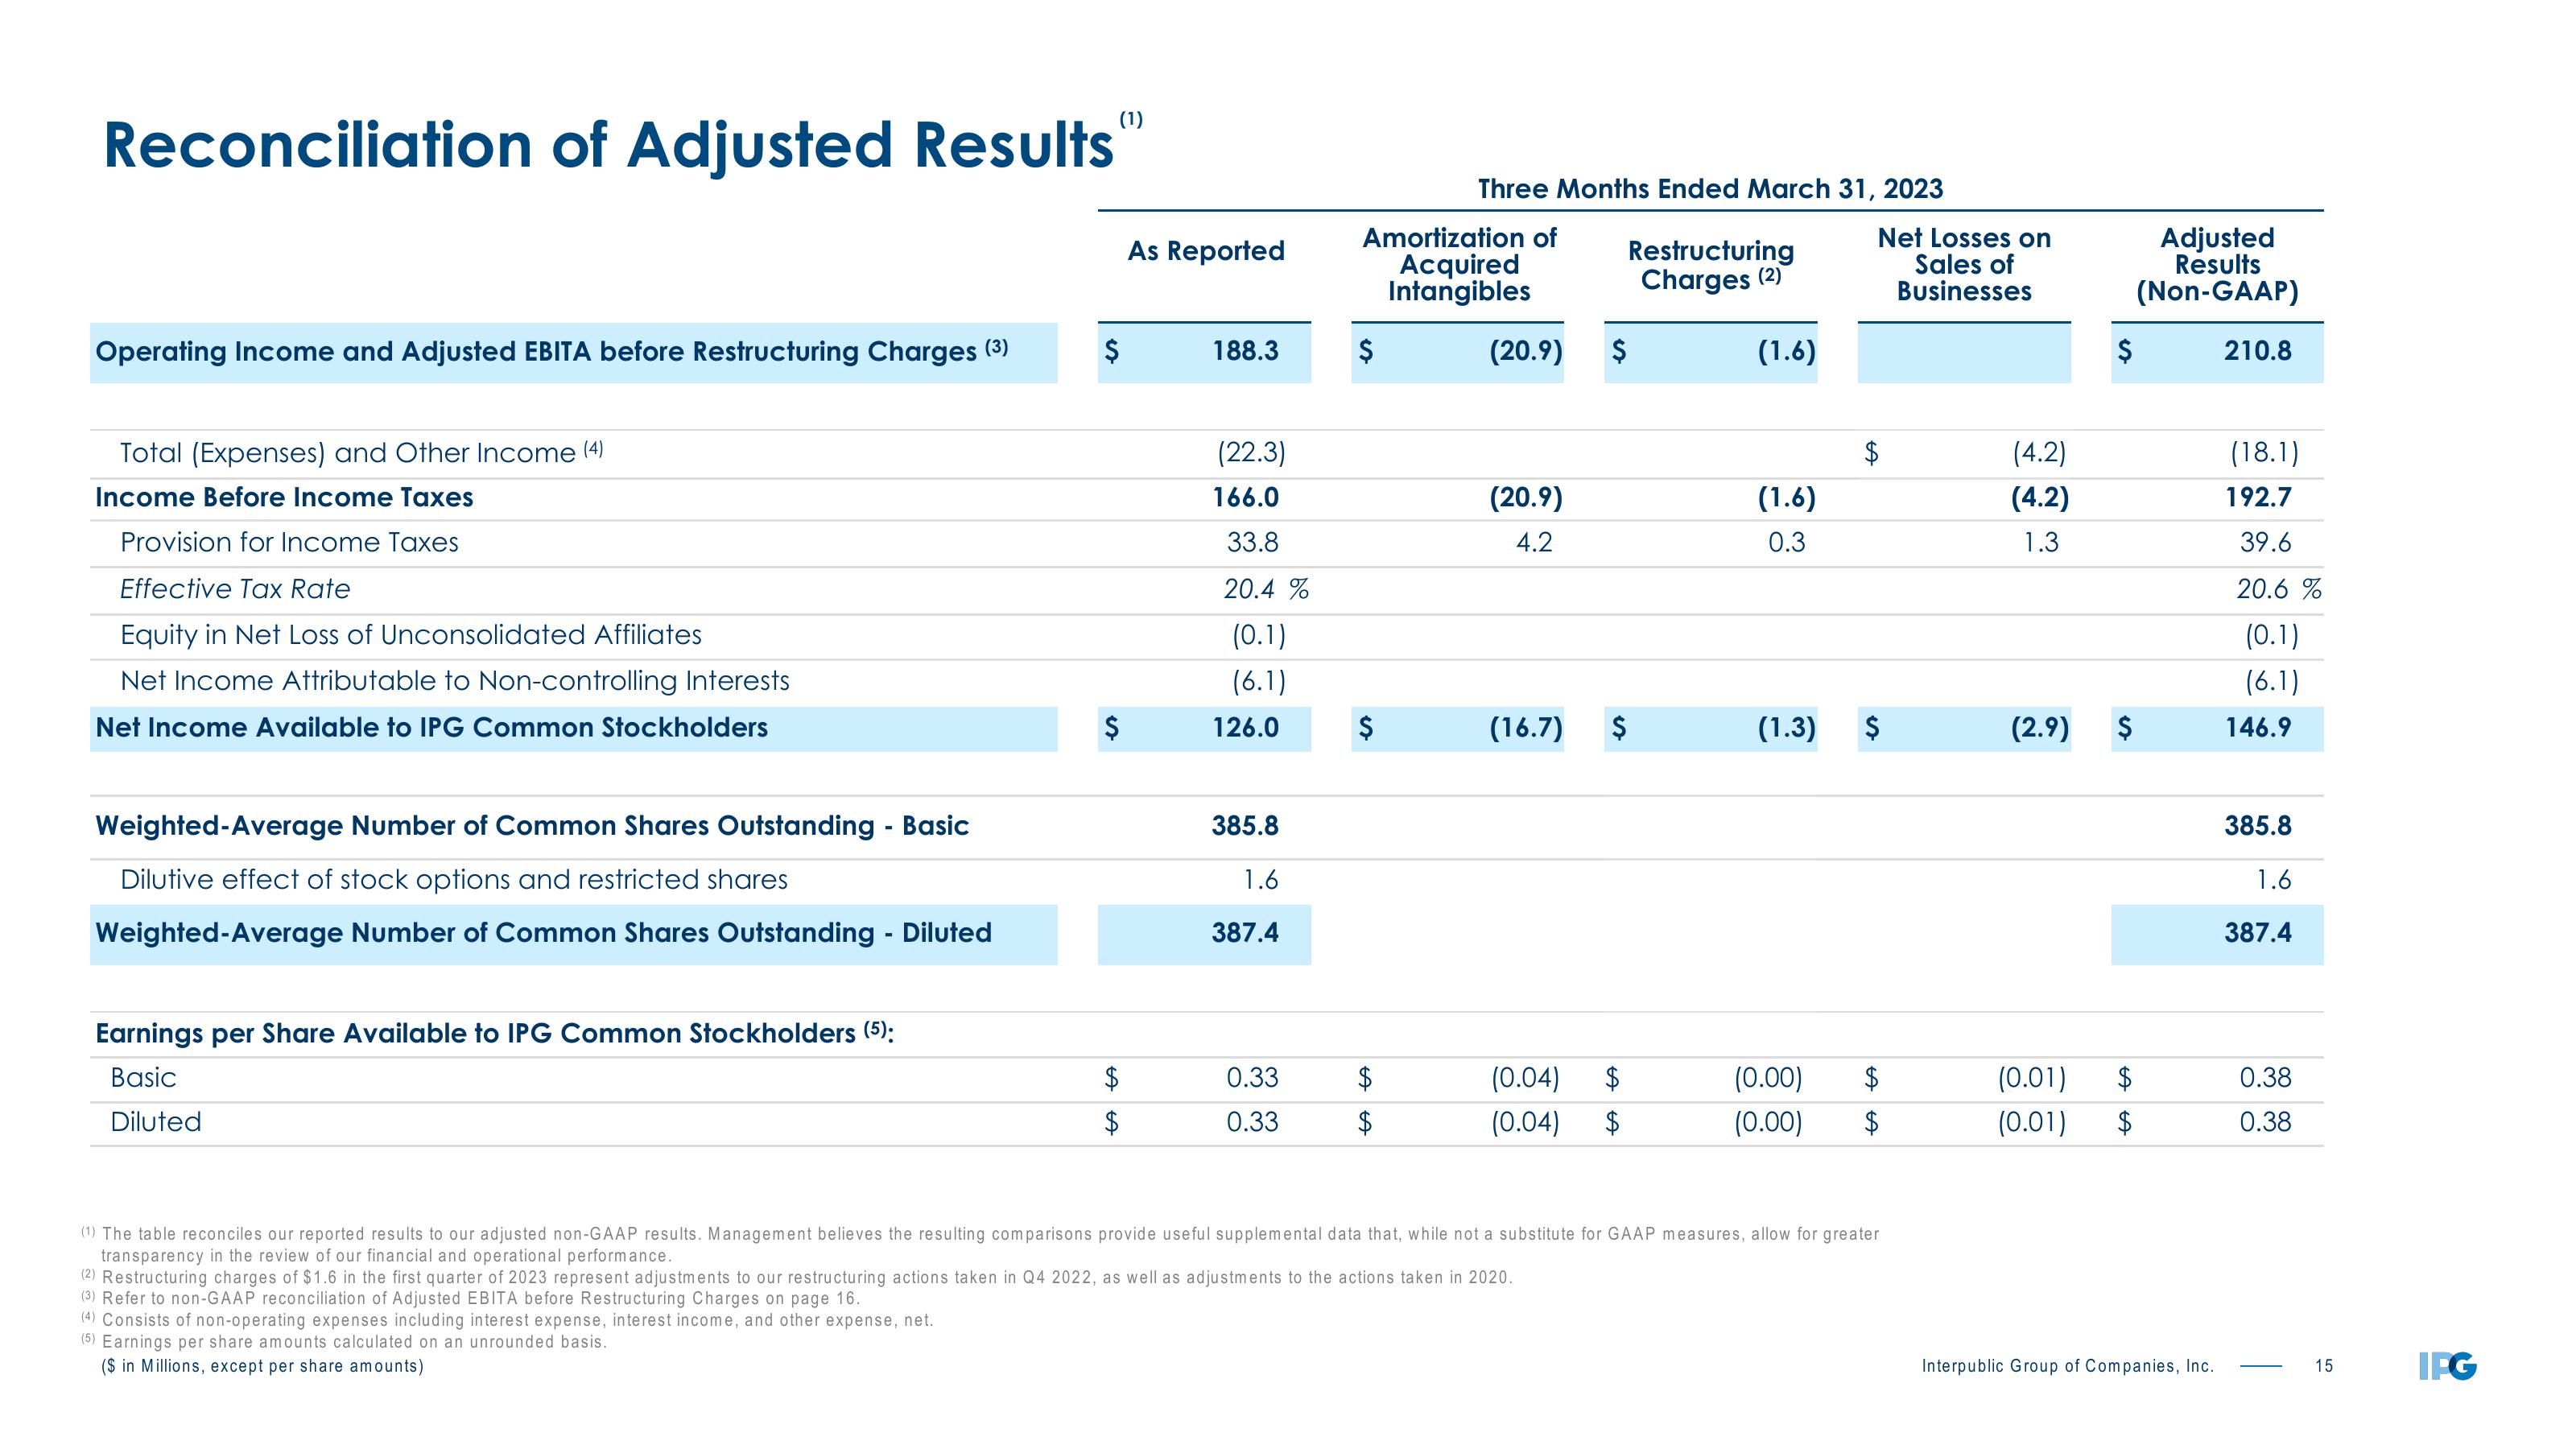
Reconciliation of Adjusted Results
Operating Income and Adjusted EBITA before Restructuring Charges (³)
Total (Expenses) and Other Income (4)
Income Before Income Taxes
Provision for Income Taxes
Effective Tax Rate
Equity in Net Loss of Unconsolidated Affiliates
Net Income Attributable to Non-controlling Interests
Net Income Available to IPG Common Stockholders
Weighted-Average Number of Common Shares Outstanding - Basic
Dilutive effect of stock options and restricted shares
Weighted-Average Number of Common Shares Outstanding - Diluted
Earnings per Share Available to IPG Common Stockholders (5):
Basic
Diluted
(4) Consists of non-operating expenses including interest expense, interest income, and other expense, net.
(5) Earnings per share amounts calculated on an unrounded basis.
($ in Millions, except per share amounts)
$
(1)
$
A
A
As Reported
188.3
(22.3)
166.0
33.8
20.4%
(0.1)
(6.1)
126.0
385.8
1.6
387.4
0.33
0.33
Amortization of
Acquired
Intangibles
$
$
Three Months Ended March 31, 2023
$
$
(20.9) $
(20.9)
4.2
(16.7)
Restructuring
Charges (2)
$
$
(0.04)
(0.04) $
(1.6)
(1.6)
0.3
(1.3) $
(0.00)
(0.00)
Net Losses on
Sales of
Businesses
A
$
(1) The table reconciles our reported results to our adjusted non-GAAP results. Management believes the resulting comparisons provide useful supplemental data that, while not a substitute for GAAP measures, allow for greater
transparency in the review of our financial and operational performance.
(2) Restructuring charges of $1.6 in the first quarter of 2023 represent adjustments to our restructuring actions taken in Q4 2022, as well as adjustments to the actions taken in 2020.
(3) Refer to non-GAAP reconciliation of Adjusted EBITA before Restructuring Charges on page 16.
(4.2)
(4.2)
1.3
(2.9)
$
$
(0.01)
(0.01) $
A
Adjusted
Results
(Non-GAAP)
Interpublic Group of Companies, Inc.
210.8
(18.1)
192.7
39.6
20.6%
(0.1)
(6.1)
146.9
385.8
1.6
387.4
0.38
0.38
15
IFGView entire presentation