Despegar Results Presentation Deck
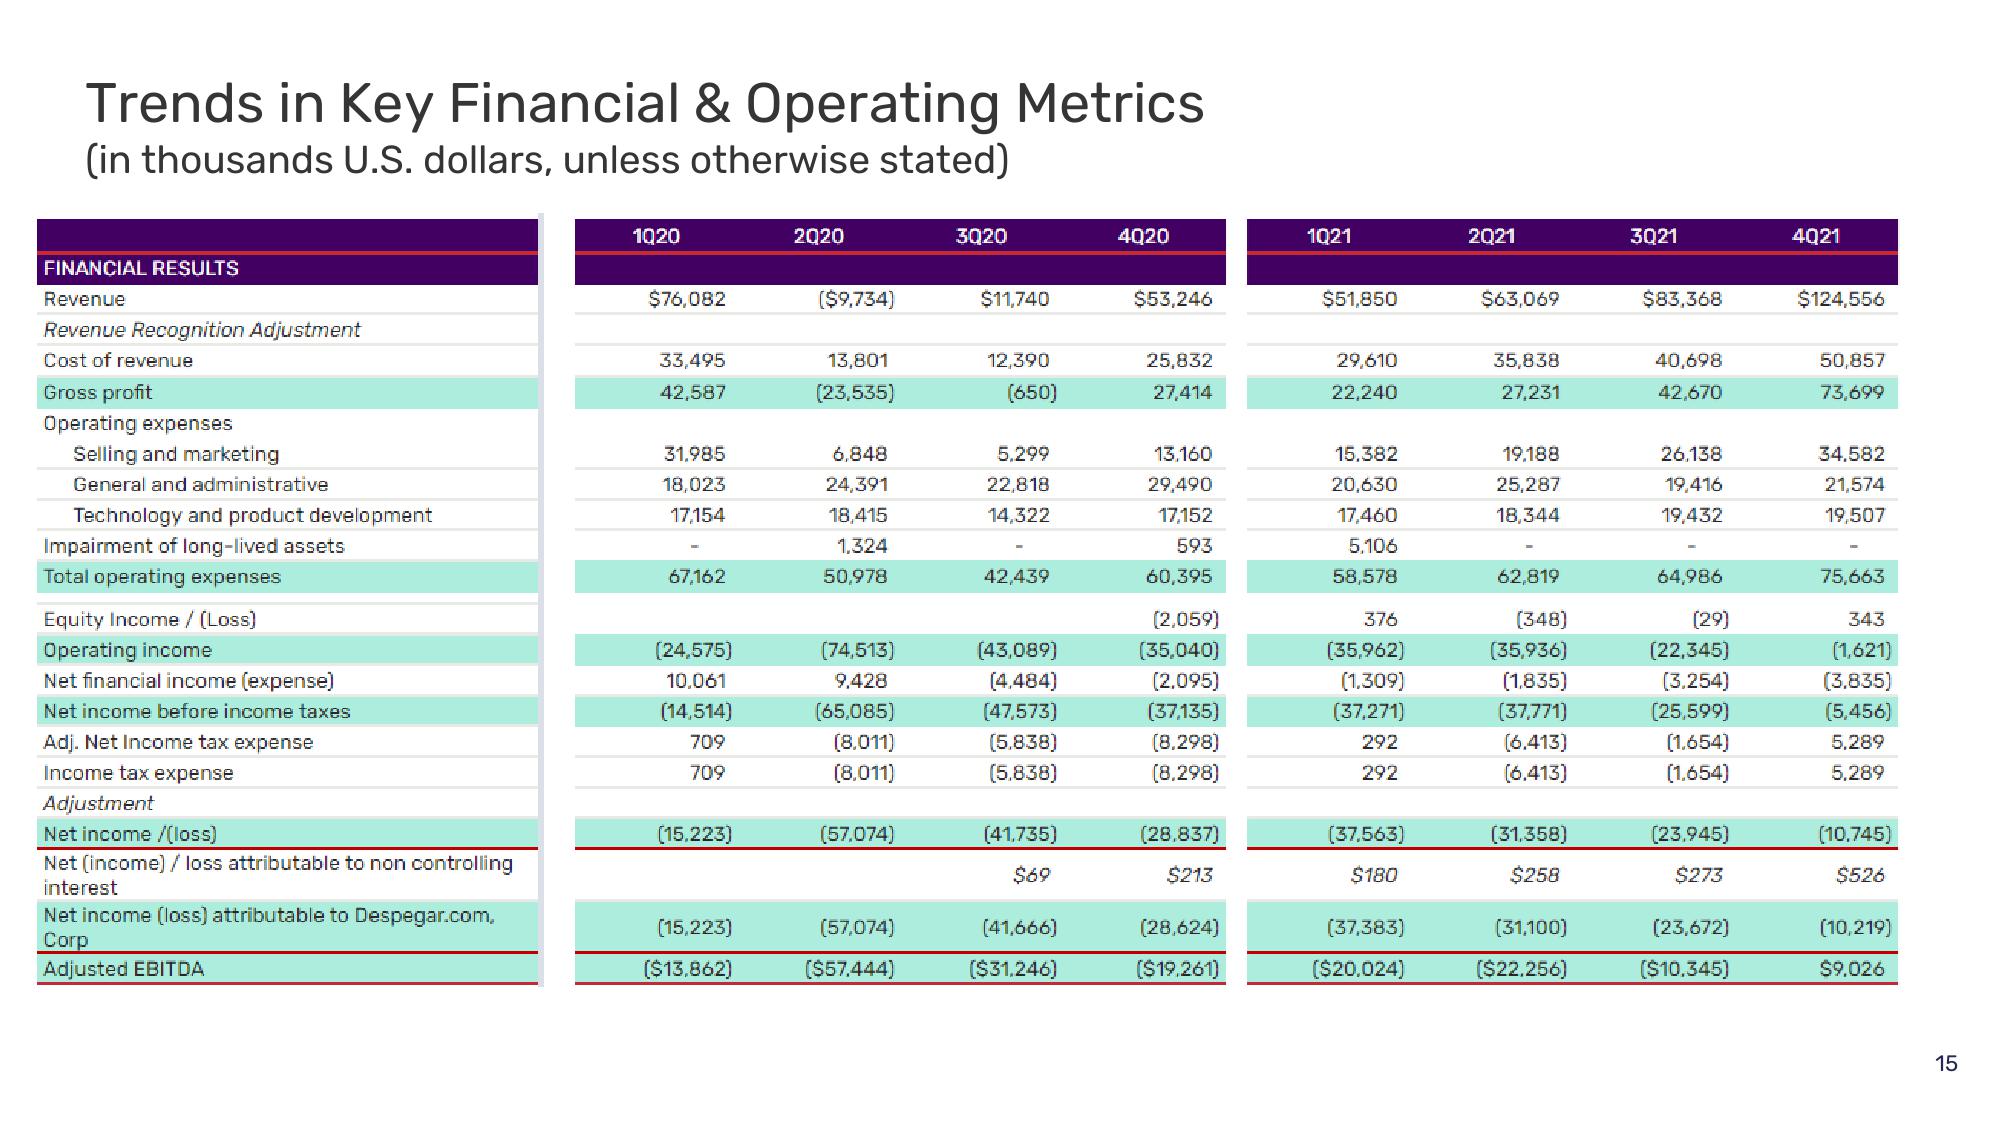
Trends in Key Financial & Operating Metrics
(in thousands U.S. dollars, unless otherwise stated)
FINANCIAL RESULTS
Revenue
Revenue Recognition Adjustment
Cost of revenue
Gross profit
Operating expenses
Selling and marketing
General and administrative
Technology and product development
Impairment of long-lived assets
Total operating expenses
Equity Income / (Loss)
Operating income
Net financial income (expense)
Net income before income taxes
Adj. Net Income tax expense
Income tax expense
Adjustment
Net income /(loss)
Net (income) / loss attributable to non controlling
interest
Net income (loss) attributable to Despegar.com,
Corp
Adjusted EBITDA
1020
$76,082
33,495
42,587
31.985
18,023
17,154
67,162
(24,575)
10.061
(14,514)
709
709
(15.223)
(15,223)
($13.862)
2020
($9,734)
13,801
(23,535)
6,848
24,391
18,415
1,324
50,978
(74,513)
9,428
(65,085)
(8.011)
(8.011)
(57.074)
(57,074)
($57.444)
3020
$11,740
12,390
(650)
5.299
22,818
14,322
42,439
(43,089)
(4.484)
(47,573)
(5.838)
(5.838)
(41,735)
$69
(41,666)
($31.246)
4020
$53,246
25,832
27,414
13,160
29,490
17,152
593
60,395
(2,059)
(35,040)
(2.095)
(37,135)
(8.298)
(8.298)
(28,837)
$213
(28,624)
($19,261)
1021
$51,850
29,610
22,240
15.382
20,630
17,460
5,106
58,578
376
(35,962)
(1.309)
(37,271)
292
292
(37,563)
$180
(37,383)
($20,024)
2021
$63,069
35,838
27,231
19.188
25,287
18,344
62,819
(348)
(35,936)
(1.835)
(37,771)
(6.413)
(6.413)
(31,358)
$258
(31,100)
($22.256)
3021
$83,368
40,698
42,670
26,138
19,416
19,432
64,986
(29)
(22,345)
(3,254)
(25,599)
(1.654)
(1.654)
(23.945)
$273
(23,672)
($10.345)
4021
$124,556
50,857
73,699
34.582
21,574
19,507
75,663
343
(1,621)
(3.835)
(5,456)
5,289
5,289
(10.745)
$526
(10,219)
$9,026
15View entire presentation