Telia Company Results Presentation Deck
Sweden financials
Service revenue
Reported currency, in SEK millions, like for like growth
+1.8%
7,380
Q1 22
+1.2%
7,446
Q2 22
■Consumer
+1.2%
7,429
Q3 22
-1.0%
7,597
Q4 22
+0.4%
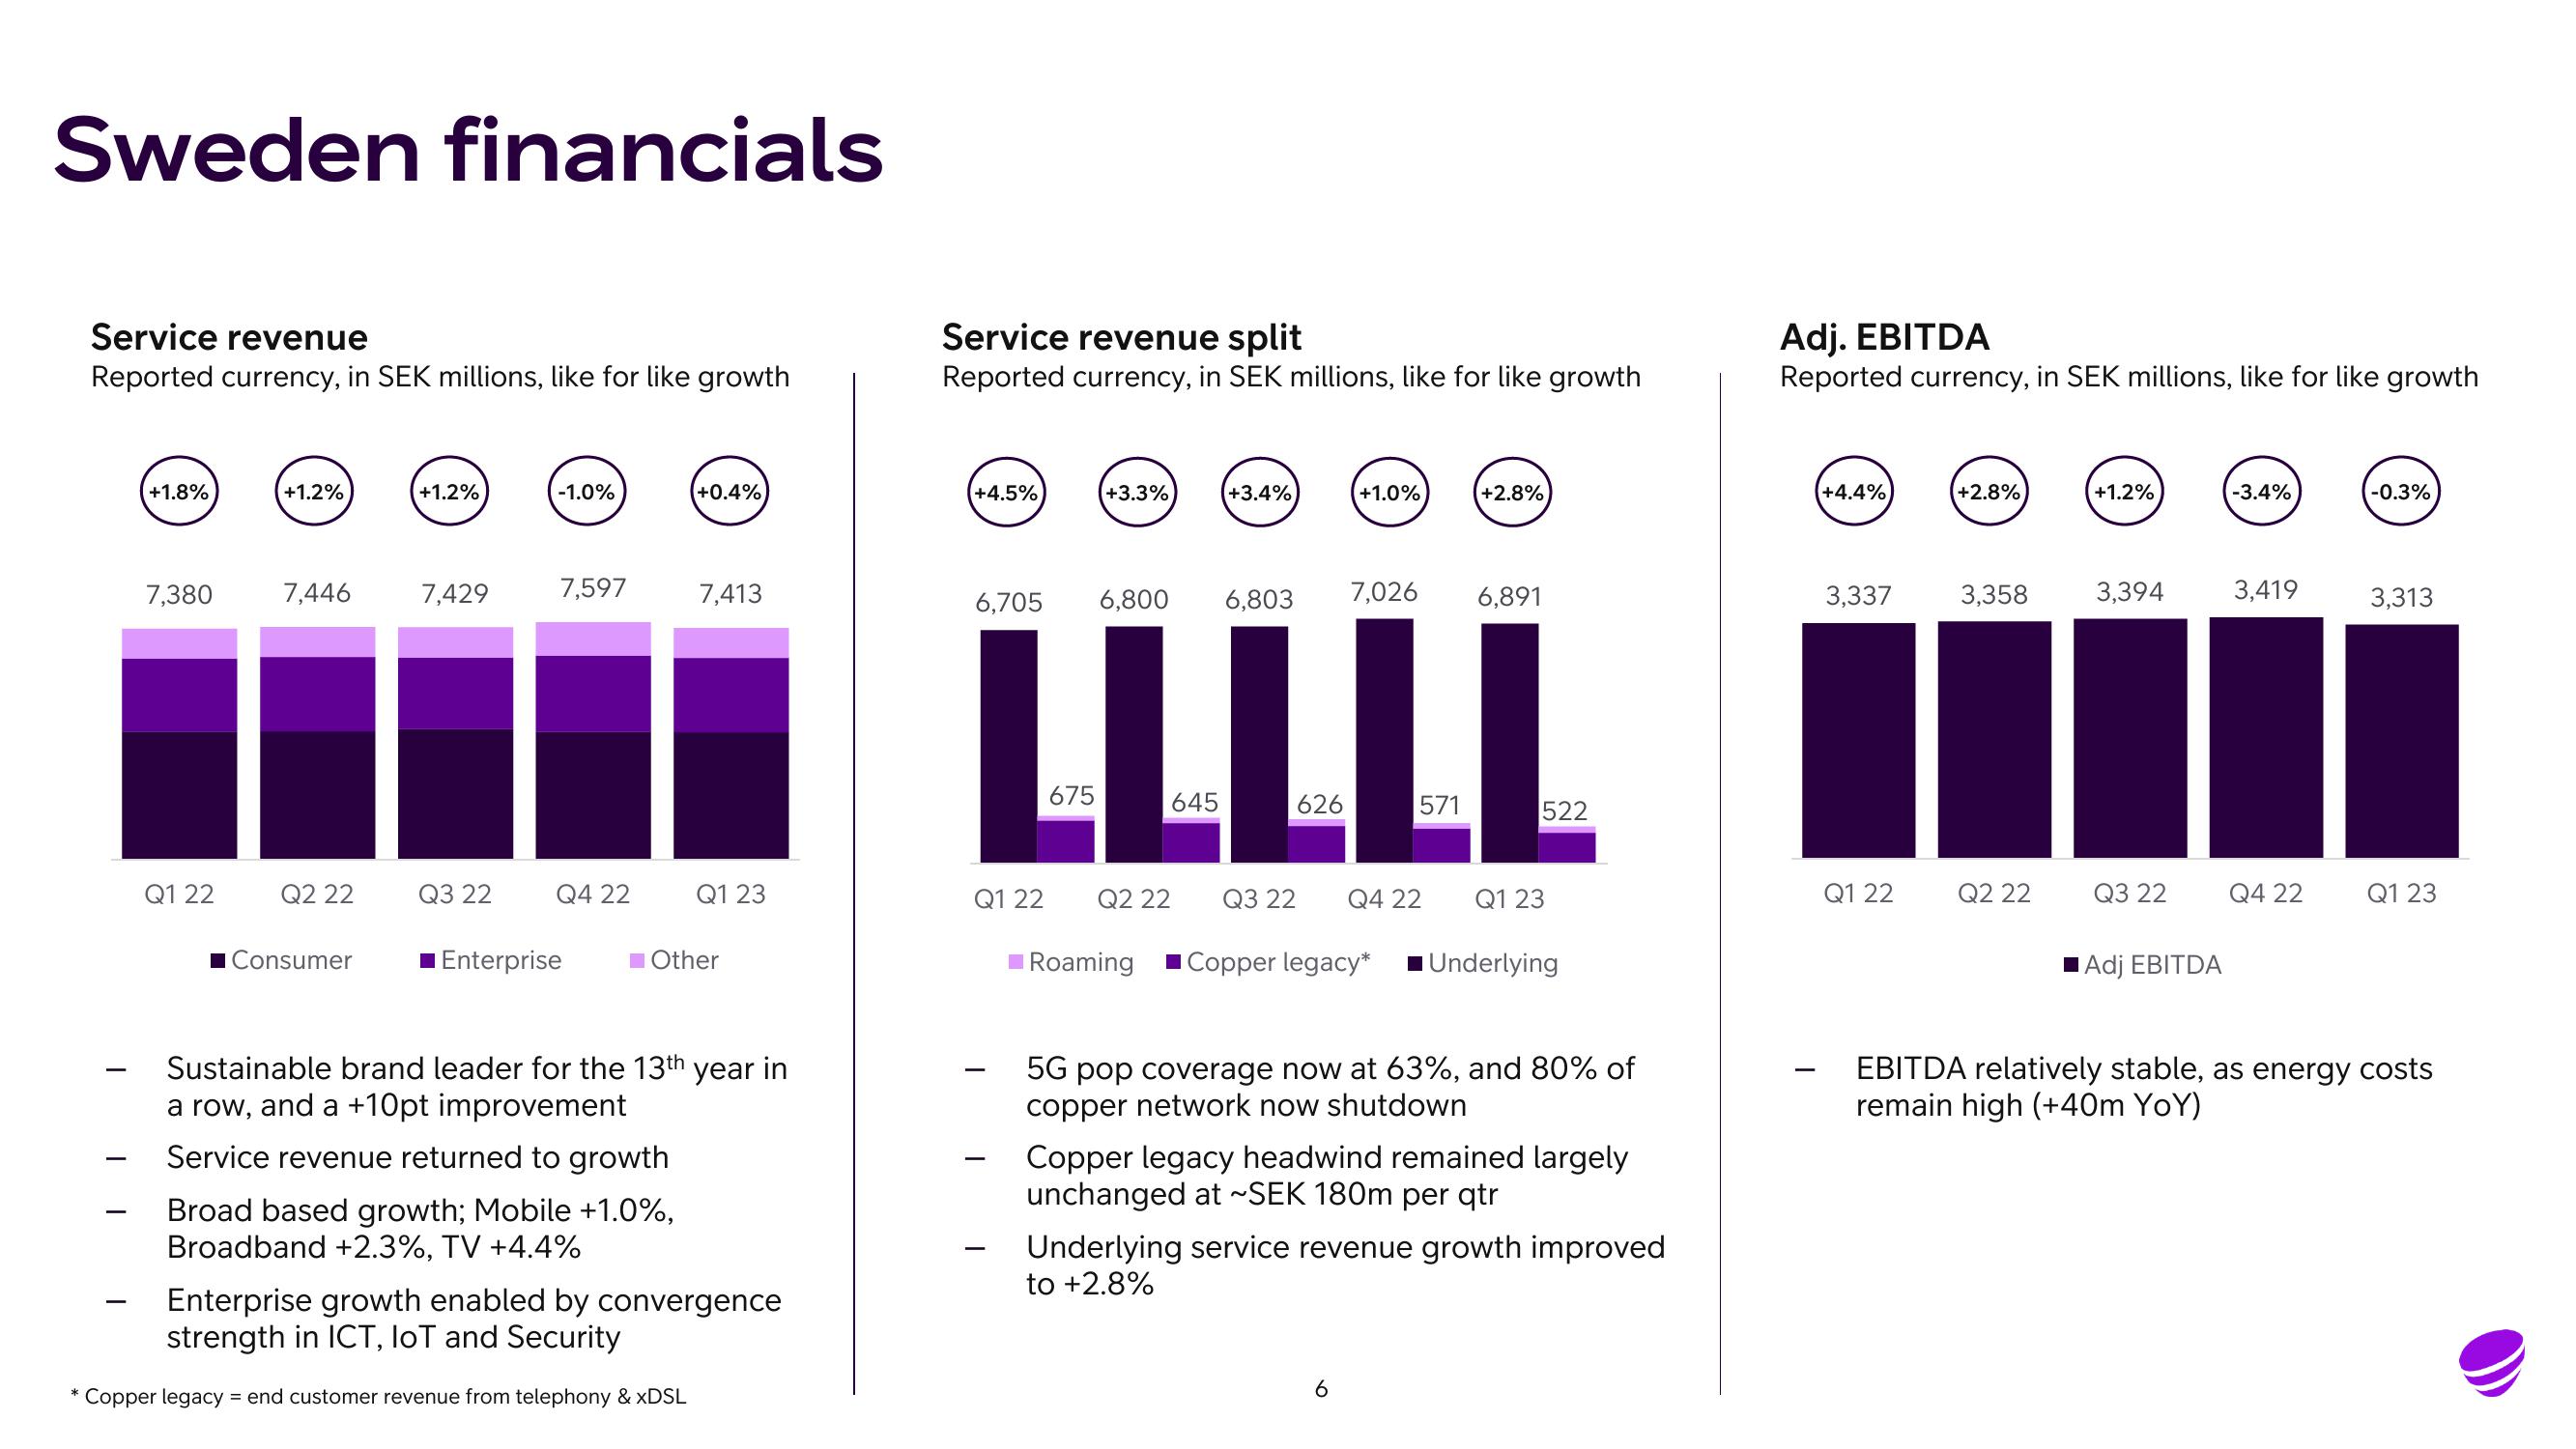
Broad based growth; Mobile +1.0%,
Broadband +2.3%, TV +4.4%
7,413
■ Enterprise ■ Other
Q1 23
Sustainable brand leader for the 13th year in
a row, and a +10pt improvement
Service revenue returned to growth
Copper legacy = end customer revenue from telephony & xDSL
Enterprise growth enabled by convergence
strength in ICT, IoT and Security
Service revenue split
Reported currency, in SEK millions, like for like growth
+4.5%
6,705
+3.3%
Q1 22
6,800
Q2 22
+3.4%
6,803
LLLLL
Q3 22
Roaming
+1.0%
7,026
+2.8%
Q4 22
6,891
522
Q1 23
Copper legacy* ■Underlying
5G pop coverage now at 63%, and 80% of
copper network now shutdown
Copper legacy headwind remained largely
unchanged at ~SEK 180m per qtr
Underlying service revenue growth improved
to +2.8%
Adj. EBITDA
Reported currency, in SEK millions, like for like growth
+4.4%
3,337
Q1 22
+2.8%
3,358
Q2 22
+1.2%
3,394
Q3 22
Adj EBITDA
-3.4%
3,419
Q4 22
-0.3%
3,313
Q1 23
EBITDA relatively stable, as energy costs
remain high (+40m YoY)View entire presentation