OpenText Investor Presentation Deck
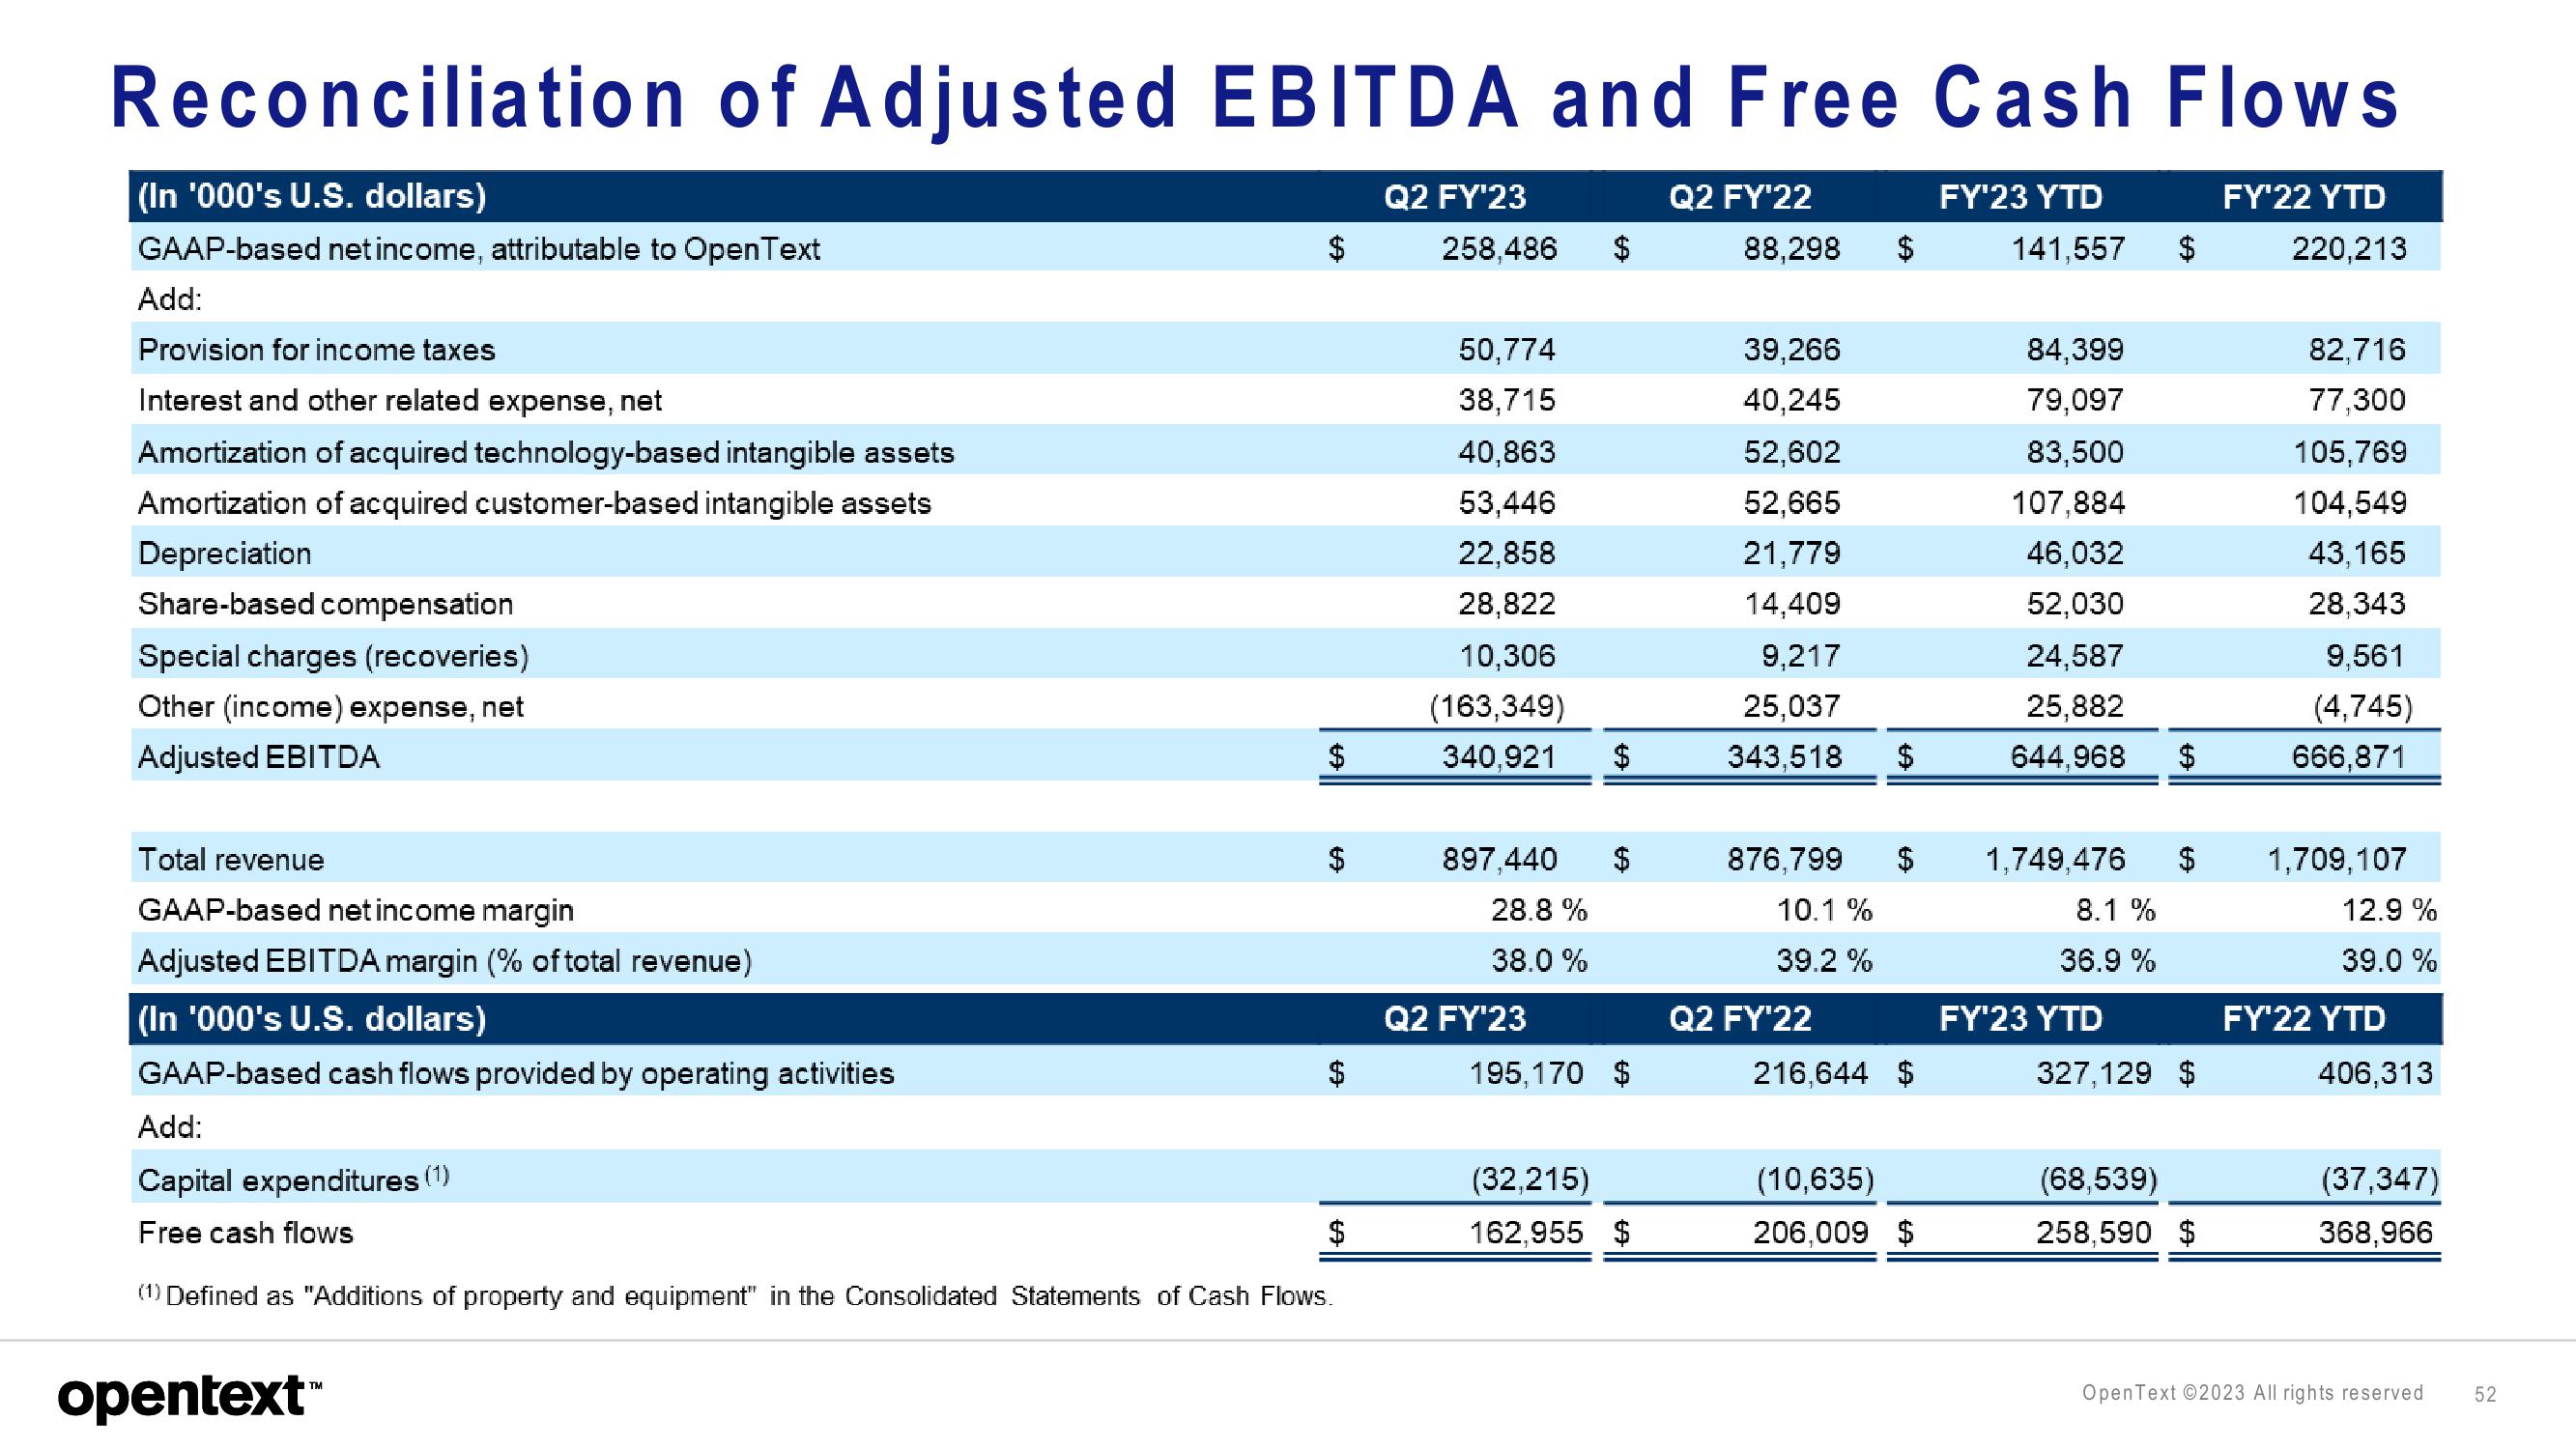
Reconciliation of Adjusted EBITDA and Free Cash Flows
(In '000's U.S. dollars)
FY'22 YTD
GAAP-based net income, attributable to Open Text
Add:
Provision for income taxes
Interest and other related expense, net
Amortization of acquired technology-based intangible assets
Amortization of acquired customer-based intangible assets
Depreciation
Share-based compensation
Special charges (recoveries)
Other (income) expense, net
Adjusted EBITDA
Total revenue
GAAP-based net income margin
Adjusted EBITDA margin (% of total revenue)
(In '000's U.S. dollars)
GAAP-based cash flows provided by operating activities
Add:
Capital expenditures (1)
Free cash flows
LA
opentext™
LA
HA
$
(1) Defined as "Additions of property and equipment" in the Consolidated Statements of Cash Flows.
Q2 FY'23
258,486
$
50,774
38,715
40,863
53,446
22,858
28,822
10,306
(163,349)
340,921 $
897,440 $
28.8 %
38.0 %
Q2 FY'23
195,170 $
(32,215)
162,955 $
Q2 FY'22
88,298 $
39,266
40,245
52,602
52,665
21,779
14,409
9,217
25,037
343,518 $
876,799 $
10.1 %
39.2 %
Q2 FY'22
216,644 $
(10,635)
206,009 $
FY'23 YTD
141,557
84,399
79,097
83,500
107,884
46,032
52,030
24,587
25,882
644,968
1,749,476
8.1 %
36.9 %
FY'23 YTD
$
$
327,129 $
(68,539)
258,590 $
220,213
82,716
77,300
105,769
104,549
43,165
28,343
9,561
(4,745)
666,871
1,709,107
12.9 %
39.0 %
FY'22 YTD
406,313
(37,347)
368,966
OpenText ©2023 All rights reserved
52View entire presentation