Flutter Results Presentation Deck
Financial Review
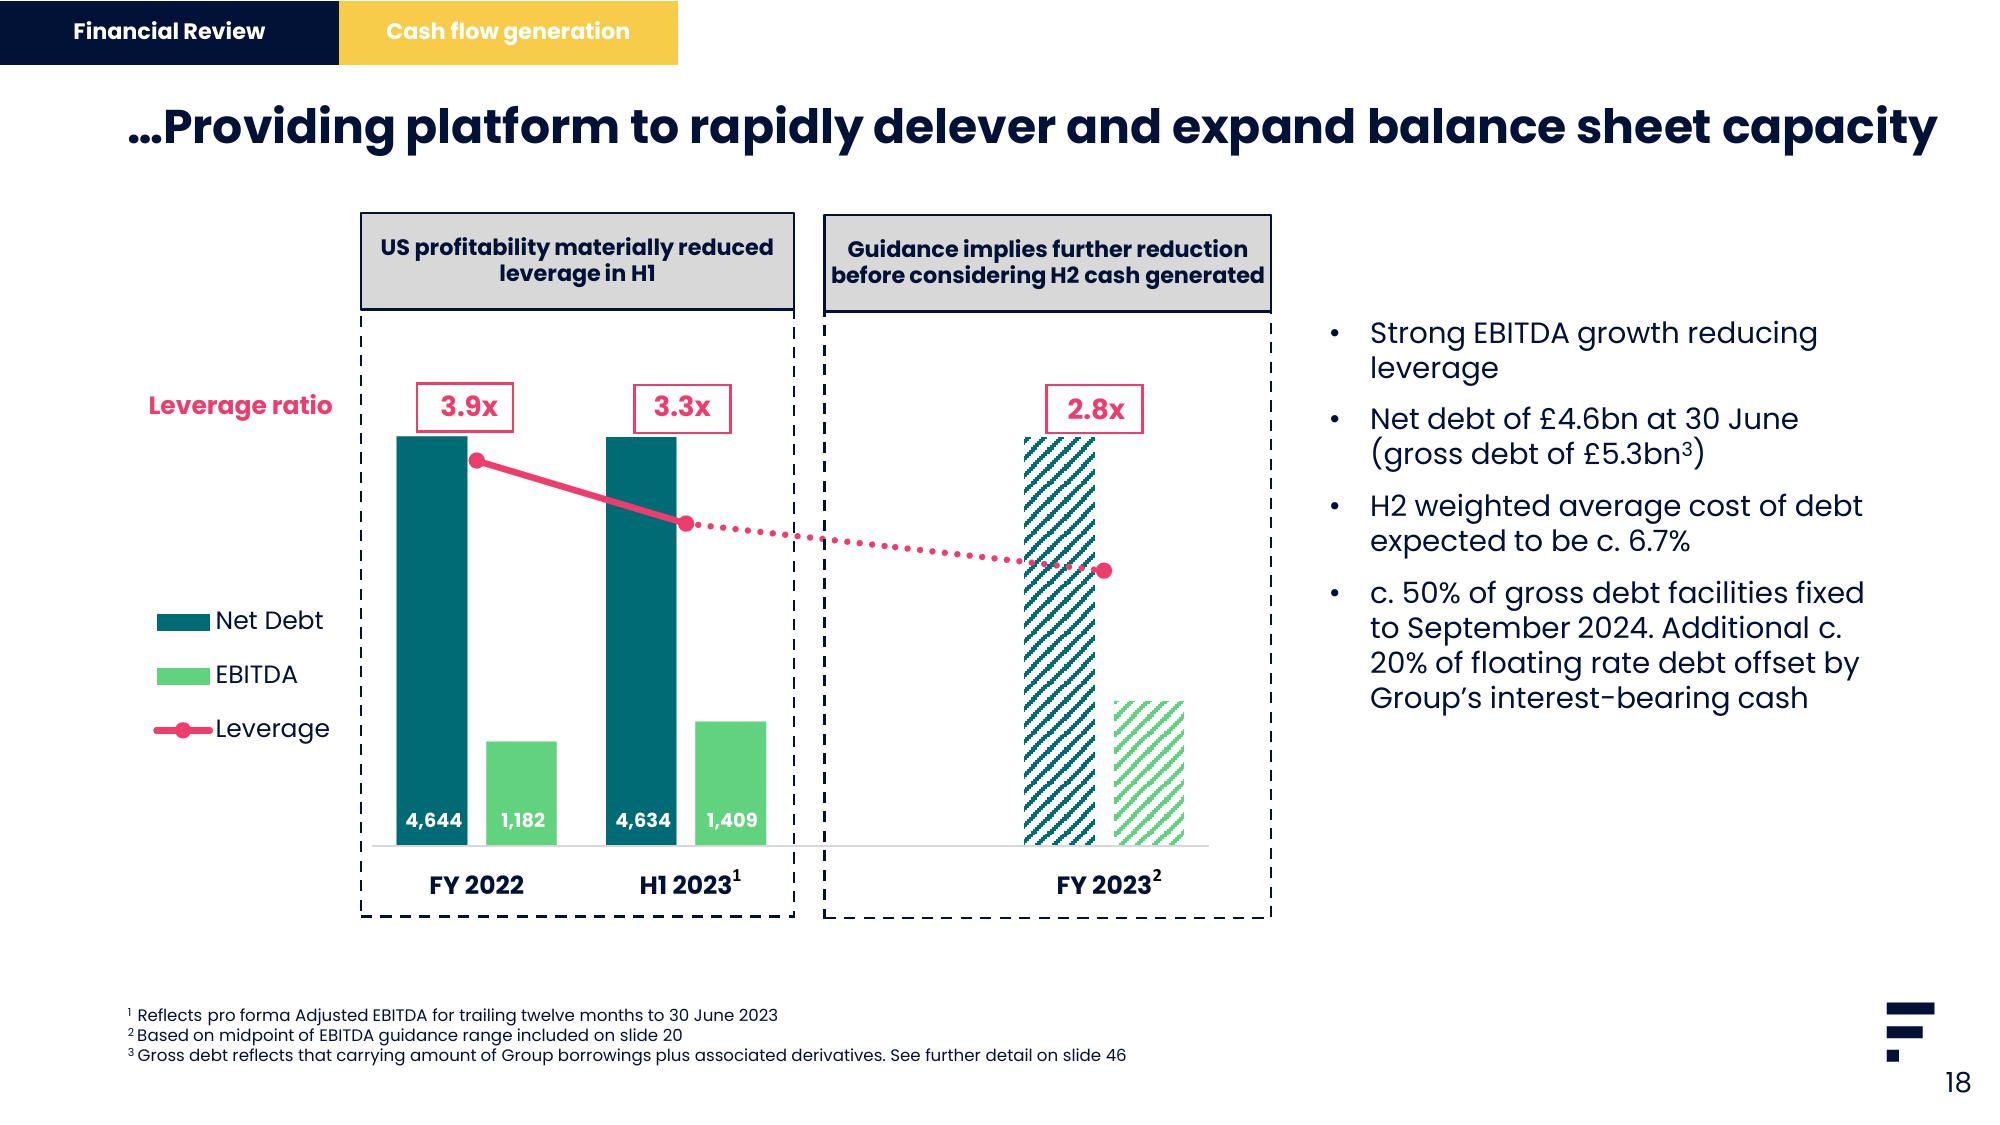
...Providing platform to rapidly delever and expand balance sheet capacity
Leverage ratio
Net Debt
EBITDA
Cash flow generation
-Leverage
US profitability materially reduced
leverage in H1
3.9x
4,644 1,182
FY 2022
3.3x
4,634 1,409
H1 20231
I
1
1
1
I
T
I
11
I
T
T
I
I
I
T
I
T
I
1
I
I
Guidance implies further reduction
before considering H2 cash generated
2.8x
FY 2023²
¹ Reflects pro forma Adjusted EBITDA for trailing twelve months to 30 June 2023
2 Based on midpoint of EBITDA guidance range included on slide 20
3 Gross debt reflects that carrying amount of Group borrowings plus associated derivatives. See further detail on slide 46
I
I
I
●
●
●
Strong EBITDA growth reducing
leverage
Net debt of £4.6bn at 30 June
(gross debt of £5.3bn³)
H2 weighted average cost of debt
expected to be c. 6.7%
c. 50% of gross debt facilities fixed
to September 2024. Additional c.
20% of floating rate debt offset by
Group's interest-bearing cash
II.
F
18View entire presentation