Meyer Burger Investor Presentation
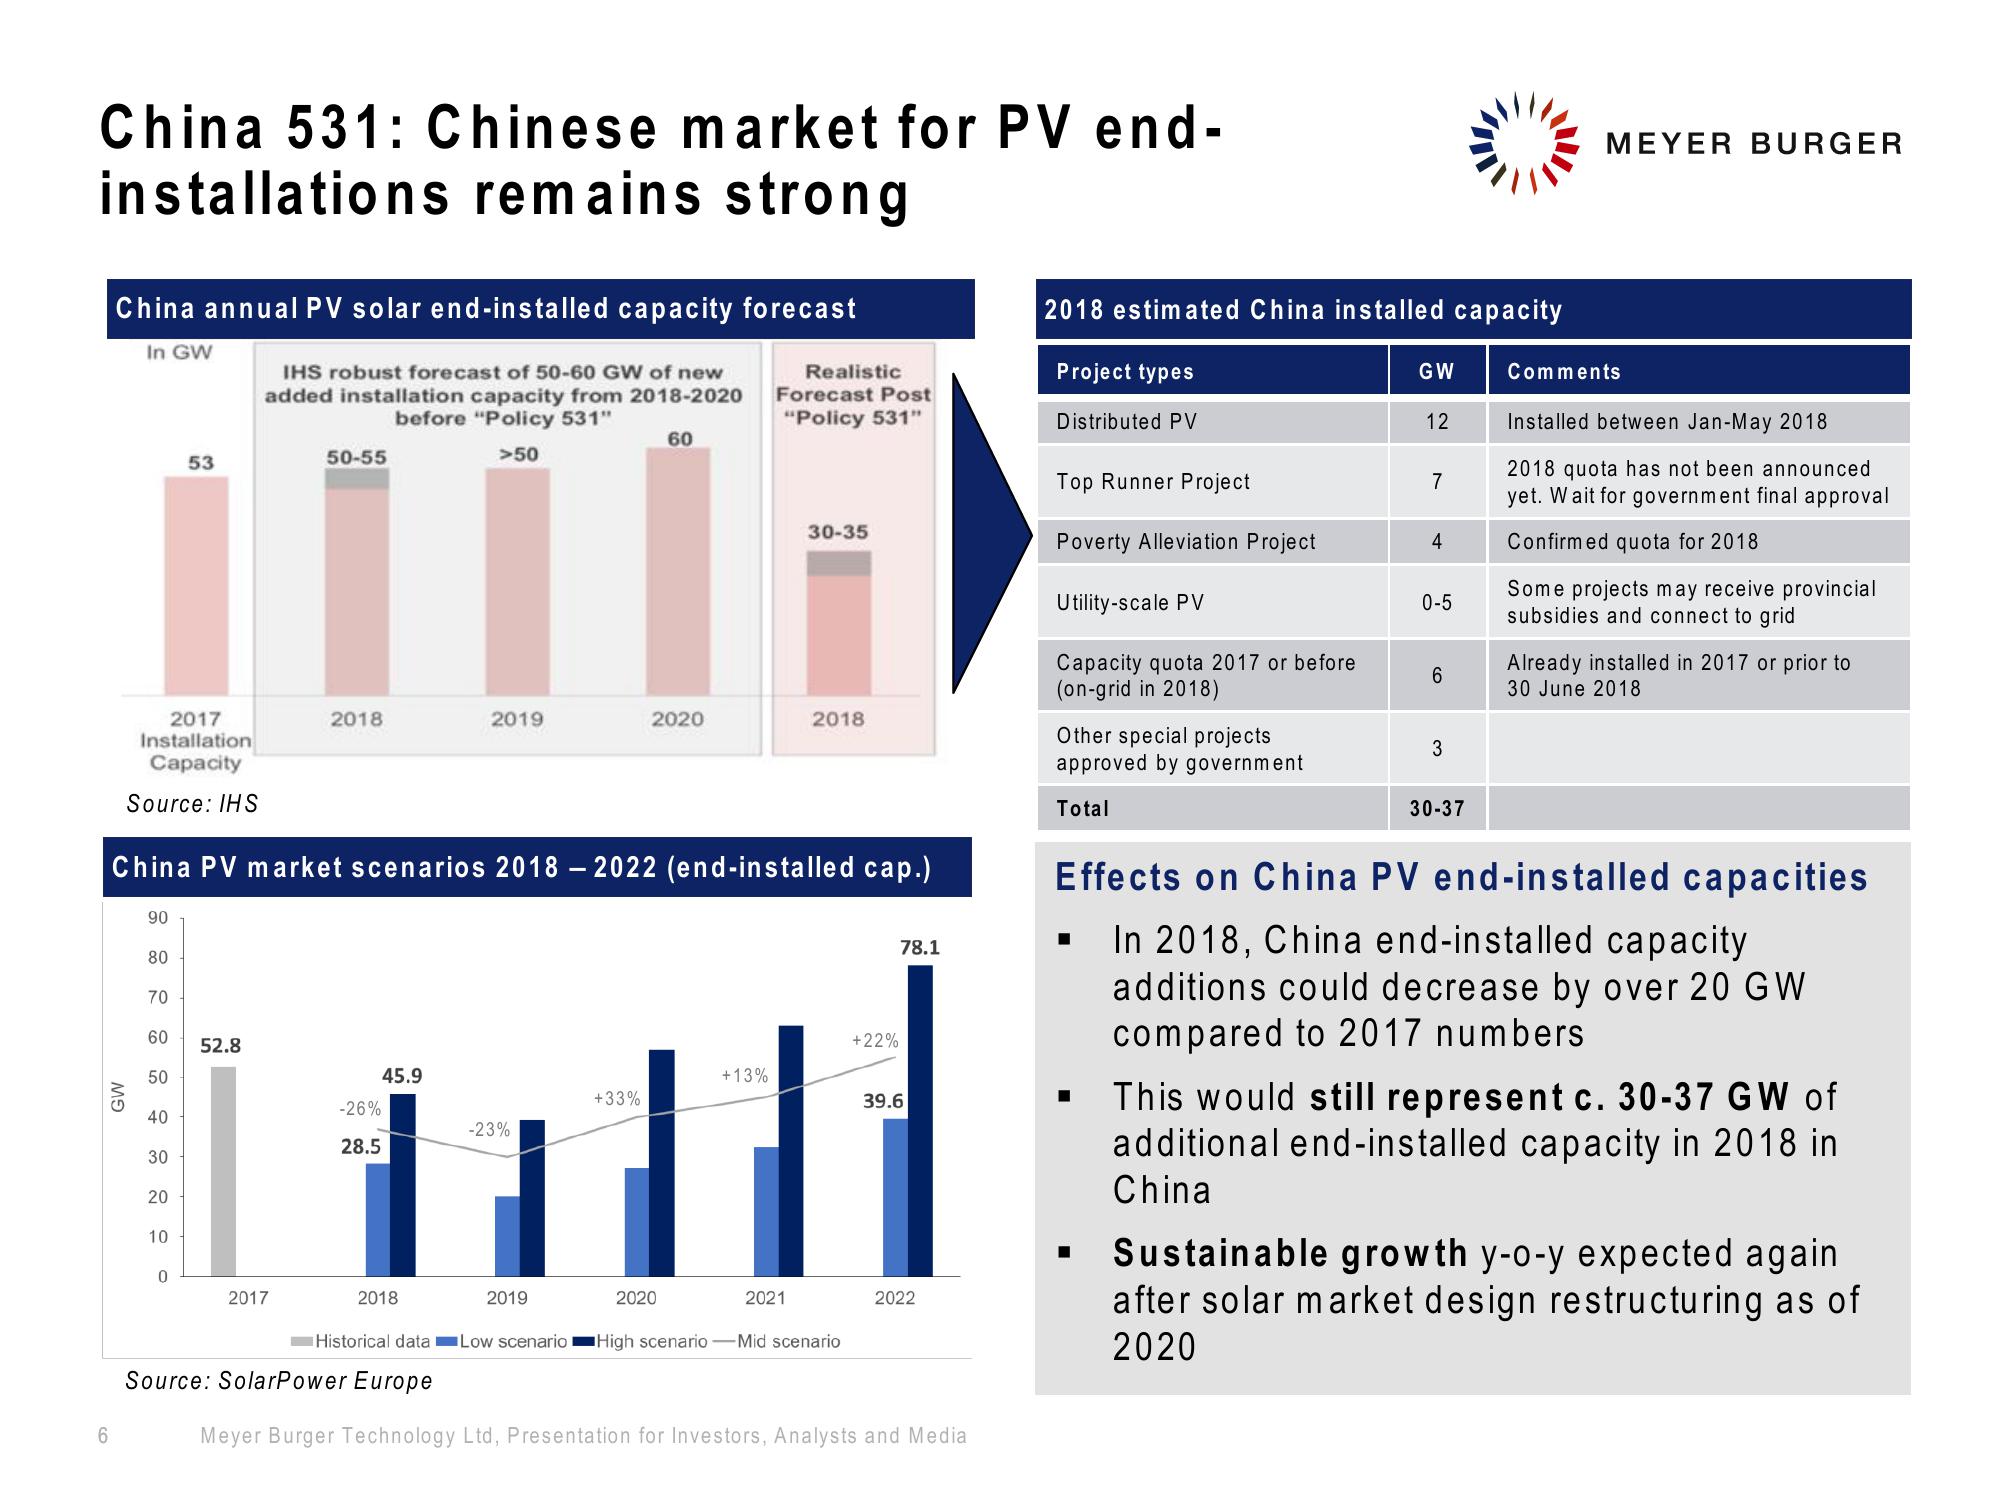
China 531: Chinese market for PV end-
installations remains strong
China annual PV solar end-installed capacity forecast
In GW
IHS robust forecast of 50-60 GW of new
added installation capacity from 2018-2020
before "Policy 531"
2018 estimated China installed capacity
Project types
6
MEYER BURGER
Realistic
Forecast Post
"Policy 531"
GW
Comments
Distributed PV
12
Installed between Jan-May 2018
60
53
50-55
>50
2018 quota has not been announced
Top Runner Project
7
yet. Wait for government final approval
30-35
Poverty Alleviation Project
4
Confirmed quota for 2018
Utility-scale PV
0-5
Some projects may receive provincial
subsidies and connect to grid
Capacity quota 2017 or before
(on-grid in 2018)
6
Already installed in 2017 or prior to
30 June 2018
2017
Installation
Capacity
2018
2019
2020
2018
Other special projects
3
approved by government
Source: IHS
China PV market scenarios 2018 – 2022 (end-installed cap.)
90
80
70
60
52.8
50
40
GW
50
30
+22%
45.9
+13%
+33%
39.6
-26%
-23%
28.5
30
20
10
0
2017
2018
2019
2020
2021
78.1
2022
Total
30-37
Effects on China PV end-installed capacities
In 2018, China end-installed capacity
additions could decrease by over 20 GW
compared to 2017 numbers
This would still represent c. 30-37 GW of
additional end-installed capacity in 2018 in
China
Sustainable growth y-o-y expected again
after solar market design restructuring as of
2020
Historical data Low scenario I High scenario-Mid scenario
Source: SolarPower Europe
Meyer Burger Technology Ltd, Presentation for Investors, Analysts and MediaView entire presentation