Owens&Minor Investor Conference Presentation Deck
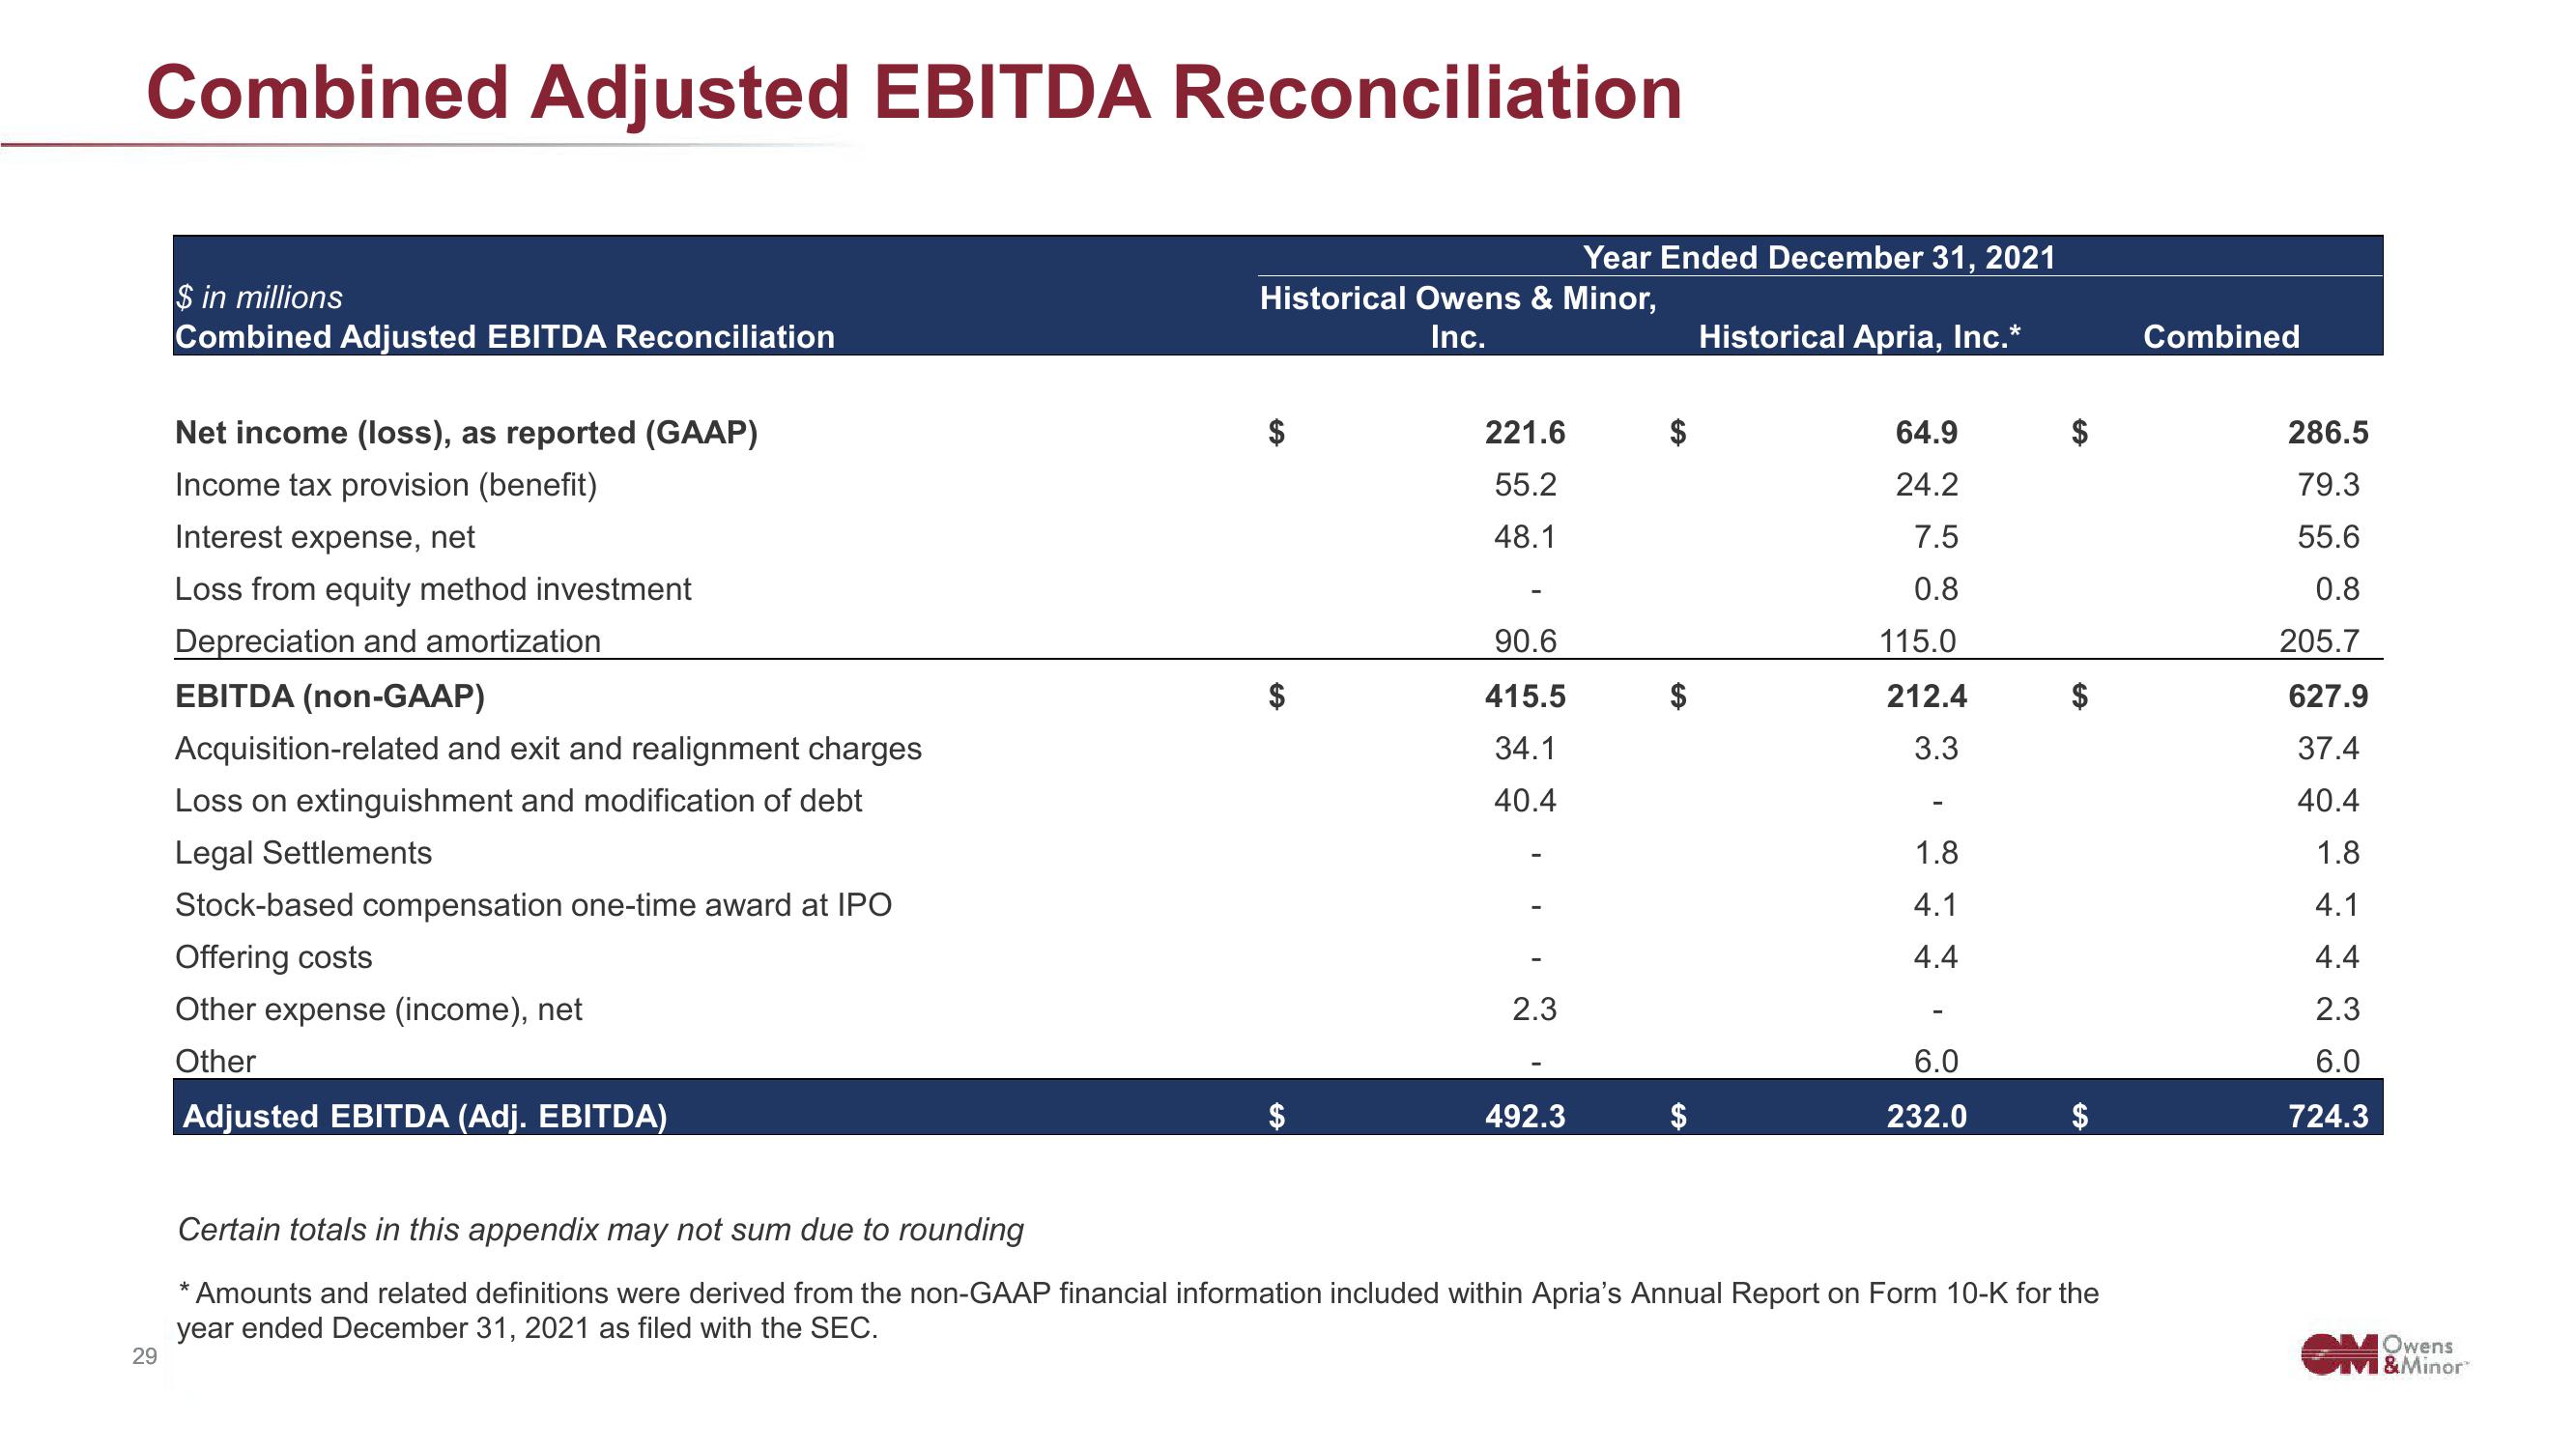
Combined Adjusted EBITDA Reconciliation
29
$ in millions
Combined Adjusted EBITDA Reconciliation
Net income (loss), as reported (GAAP)
Income tax provision (benefit)
Interest expense, net
Loss from equity method investment
Depreciation and amortization
EBITDA (non-GAAP)
Acquisition-related and exit and realignment charges
Loss on extinguishment and modification of debt
Legal Settlements
Stock-based compensation one-time award at IPO
Offering costs
Other expense (income), net
Other
Adjusted EBITDA (Adj. EBITDA)
*
Historical Owens & Minor,
Inc.
SA
221.6
55.2
48.1
90.6
415.5
34.1
40.4
2.3
Year Ended December 31, 2021
492.3
Historical Apria, Inc.*
64.9
24.2
7.5
0.8
115.0
212.4
3.3
-
1.8
4.1
4.4
6.0
232.0
LA
SA
Certain totals in this appendix may not sum due to rounding
Amounts and related definitions were derived from the non-GAAP financial information included within Apria's Annual Report on Form 10-K for the
year ended December 31, 2021 as filed with the SEC.
Combined
286.5
79.3
55.6
0.8
205.7
627.9
37.4
40.4
1.8
4.1
4.4
2.3
6.0
724.3
Owens
VI & MinorView entire presentation