Karat IPO Presentation Deck
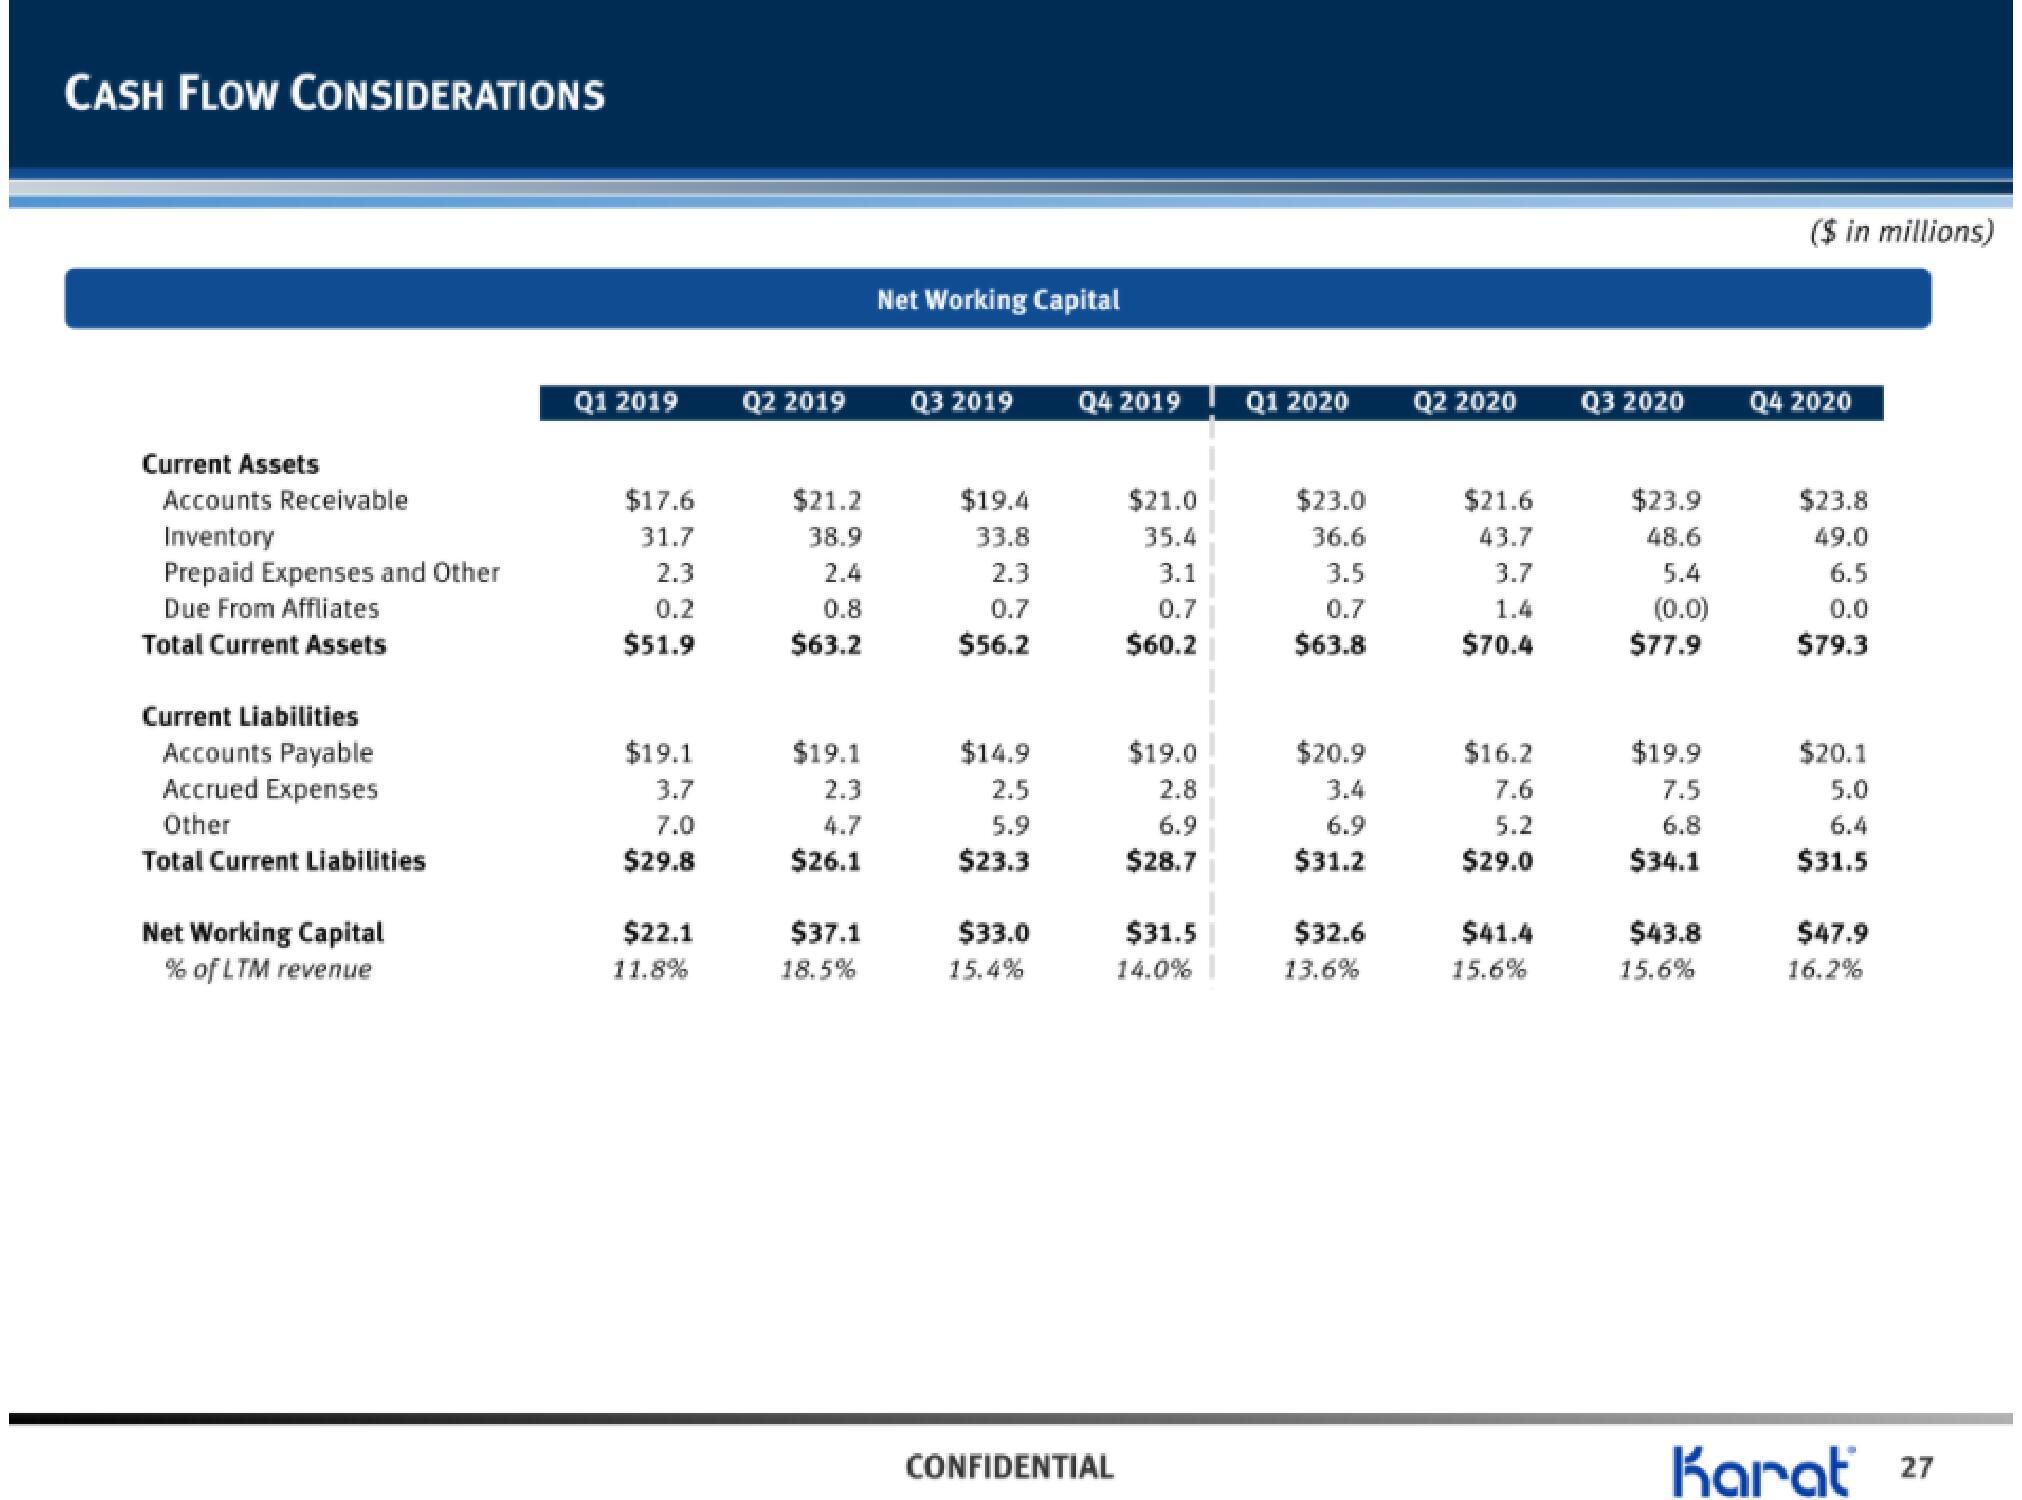
CASH FLOW CONSIDERATIONS
Current Assets
Accounts Receivable
Inventory
Prepaid Expenses and Other
Due From Affliates
Total Current Assets
Current Liabilities
Accounts Payable
Accrued Expenses
Other
Total Current Liabilities
Net Working Capital
% of LTM revenue
Q1 2019
$17.6
31.7
2.3
0.2
$51.9
$19.1
3.7
7.0
$29.8
$22.1
11.8%
Q2 2019
$21.2
38.9
2.4
0.8
$63.2
$19.1
2.3
4.7
$26.1
$37.1
18.5%
Net Working Capital
Q3 2019
$19.4
33.8
2.3
0.7
$56.2
$14.9
2.5
5.9
$23.3
$33.0
15.4%
Q4 2019
CONFIDENTIAL
$21.0
35.4
3.1
0.7
$60.2
$19.0
2.8
6.9
$28.7
$31.5
14.0%
Q1 2020
$23.0
36.6
3.5
0.7
$63.8
$20.9
3.4
6.9
$31.2
$32.6
13.6%
Q2 2020
$21.6
43.7
3.7
1.4
$70.4
$16.2
7.6
5.2
$29.0
$41.4
15.6%
Q3 2020
$23.9
48.6
5.4
(0.0)
$77.9
$19.9
7.5
6.8
$34.1
$43.8
15.6%
($ in millions)
Q4 2020
$23.8
49.0
6.5
0.0
$79.3
$20.1
5.0
6.4
$31.5
$47.9
16.2%
Karat 27View entire presentation