GlobalFoundries Results Presentation Deck
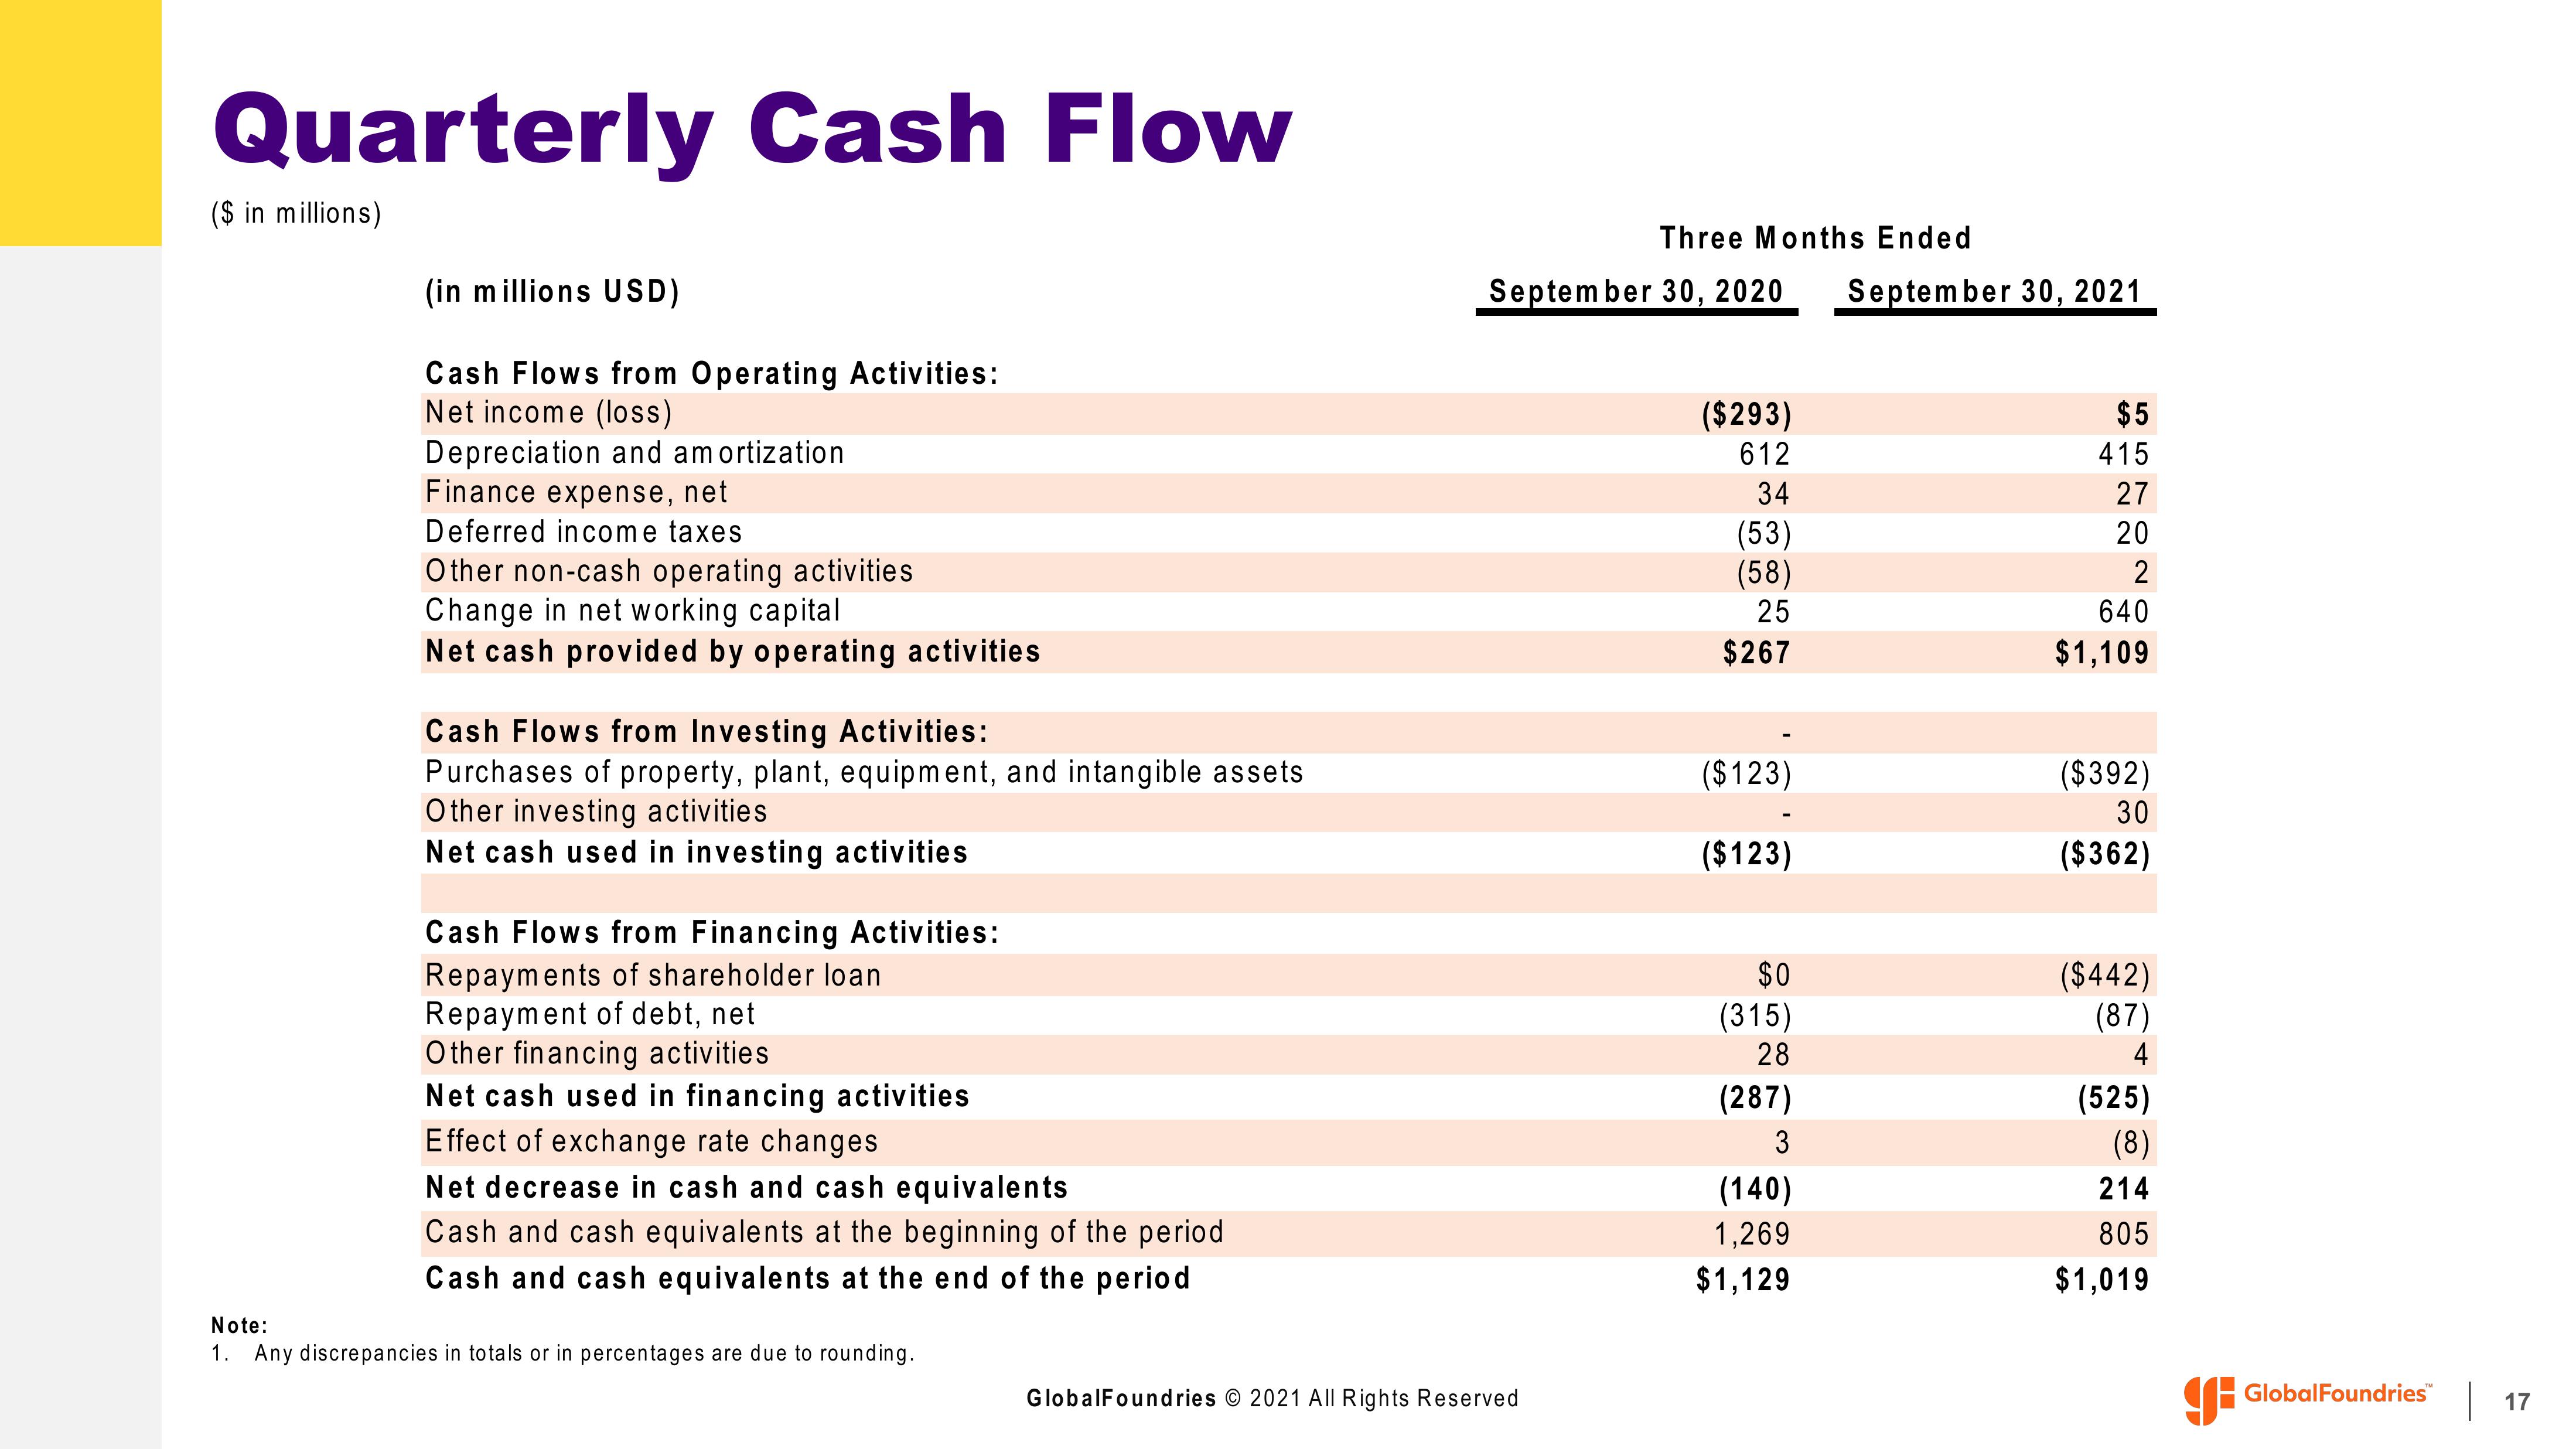
Quarterly Cash Flow
($ in millions)
(in millions USD)
Cash Flows from Operating Activities:
Net income (loss)
Depreciation and amortization
Finance expense, net
Deferred income taxes
Other non-cash operating activities
Change in net working capital
Net cash provided by operating activities
Cash Flows from Investing Activities:
Purchases of property, plant, equipment, and intangible assets
Other investing activities
Net cash used in investing activities
Cash Flows from Financing Activities:
Repayments of shareholder loan
Repayment of debt, net
Other financing activities
Net cash used in financing activities
Effect of exchange rate changes
Net decrease in cash and cash equivalents
Cash and cash equivalents at the beginning of the period
Cash and cash equivalents at the end of the period
Note:
1. Any discrepancies in totals or in percentages are due to rounding.
Three Months Ended
September 30, 2020 September 30, 2021
GlobalFoundries © 2021 All Rights Reserved
($293)
612
34
(53)
(58)
25
$267
($123)
($123)
$0
(315)
28
(287)
3
(140)
1,269
$1,129
$5
415
27
20
2
640
$1,109
($392)
30
($362)
($442)
(87)
4
(525)
(8)
214
805
$1,019
GlobalFoundries™
17View entire presentation