Snap Inc Results Presentation Deck
Second Quarter Financial Highlights
Revenue
Operating
Performance
Cash
●
●
●
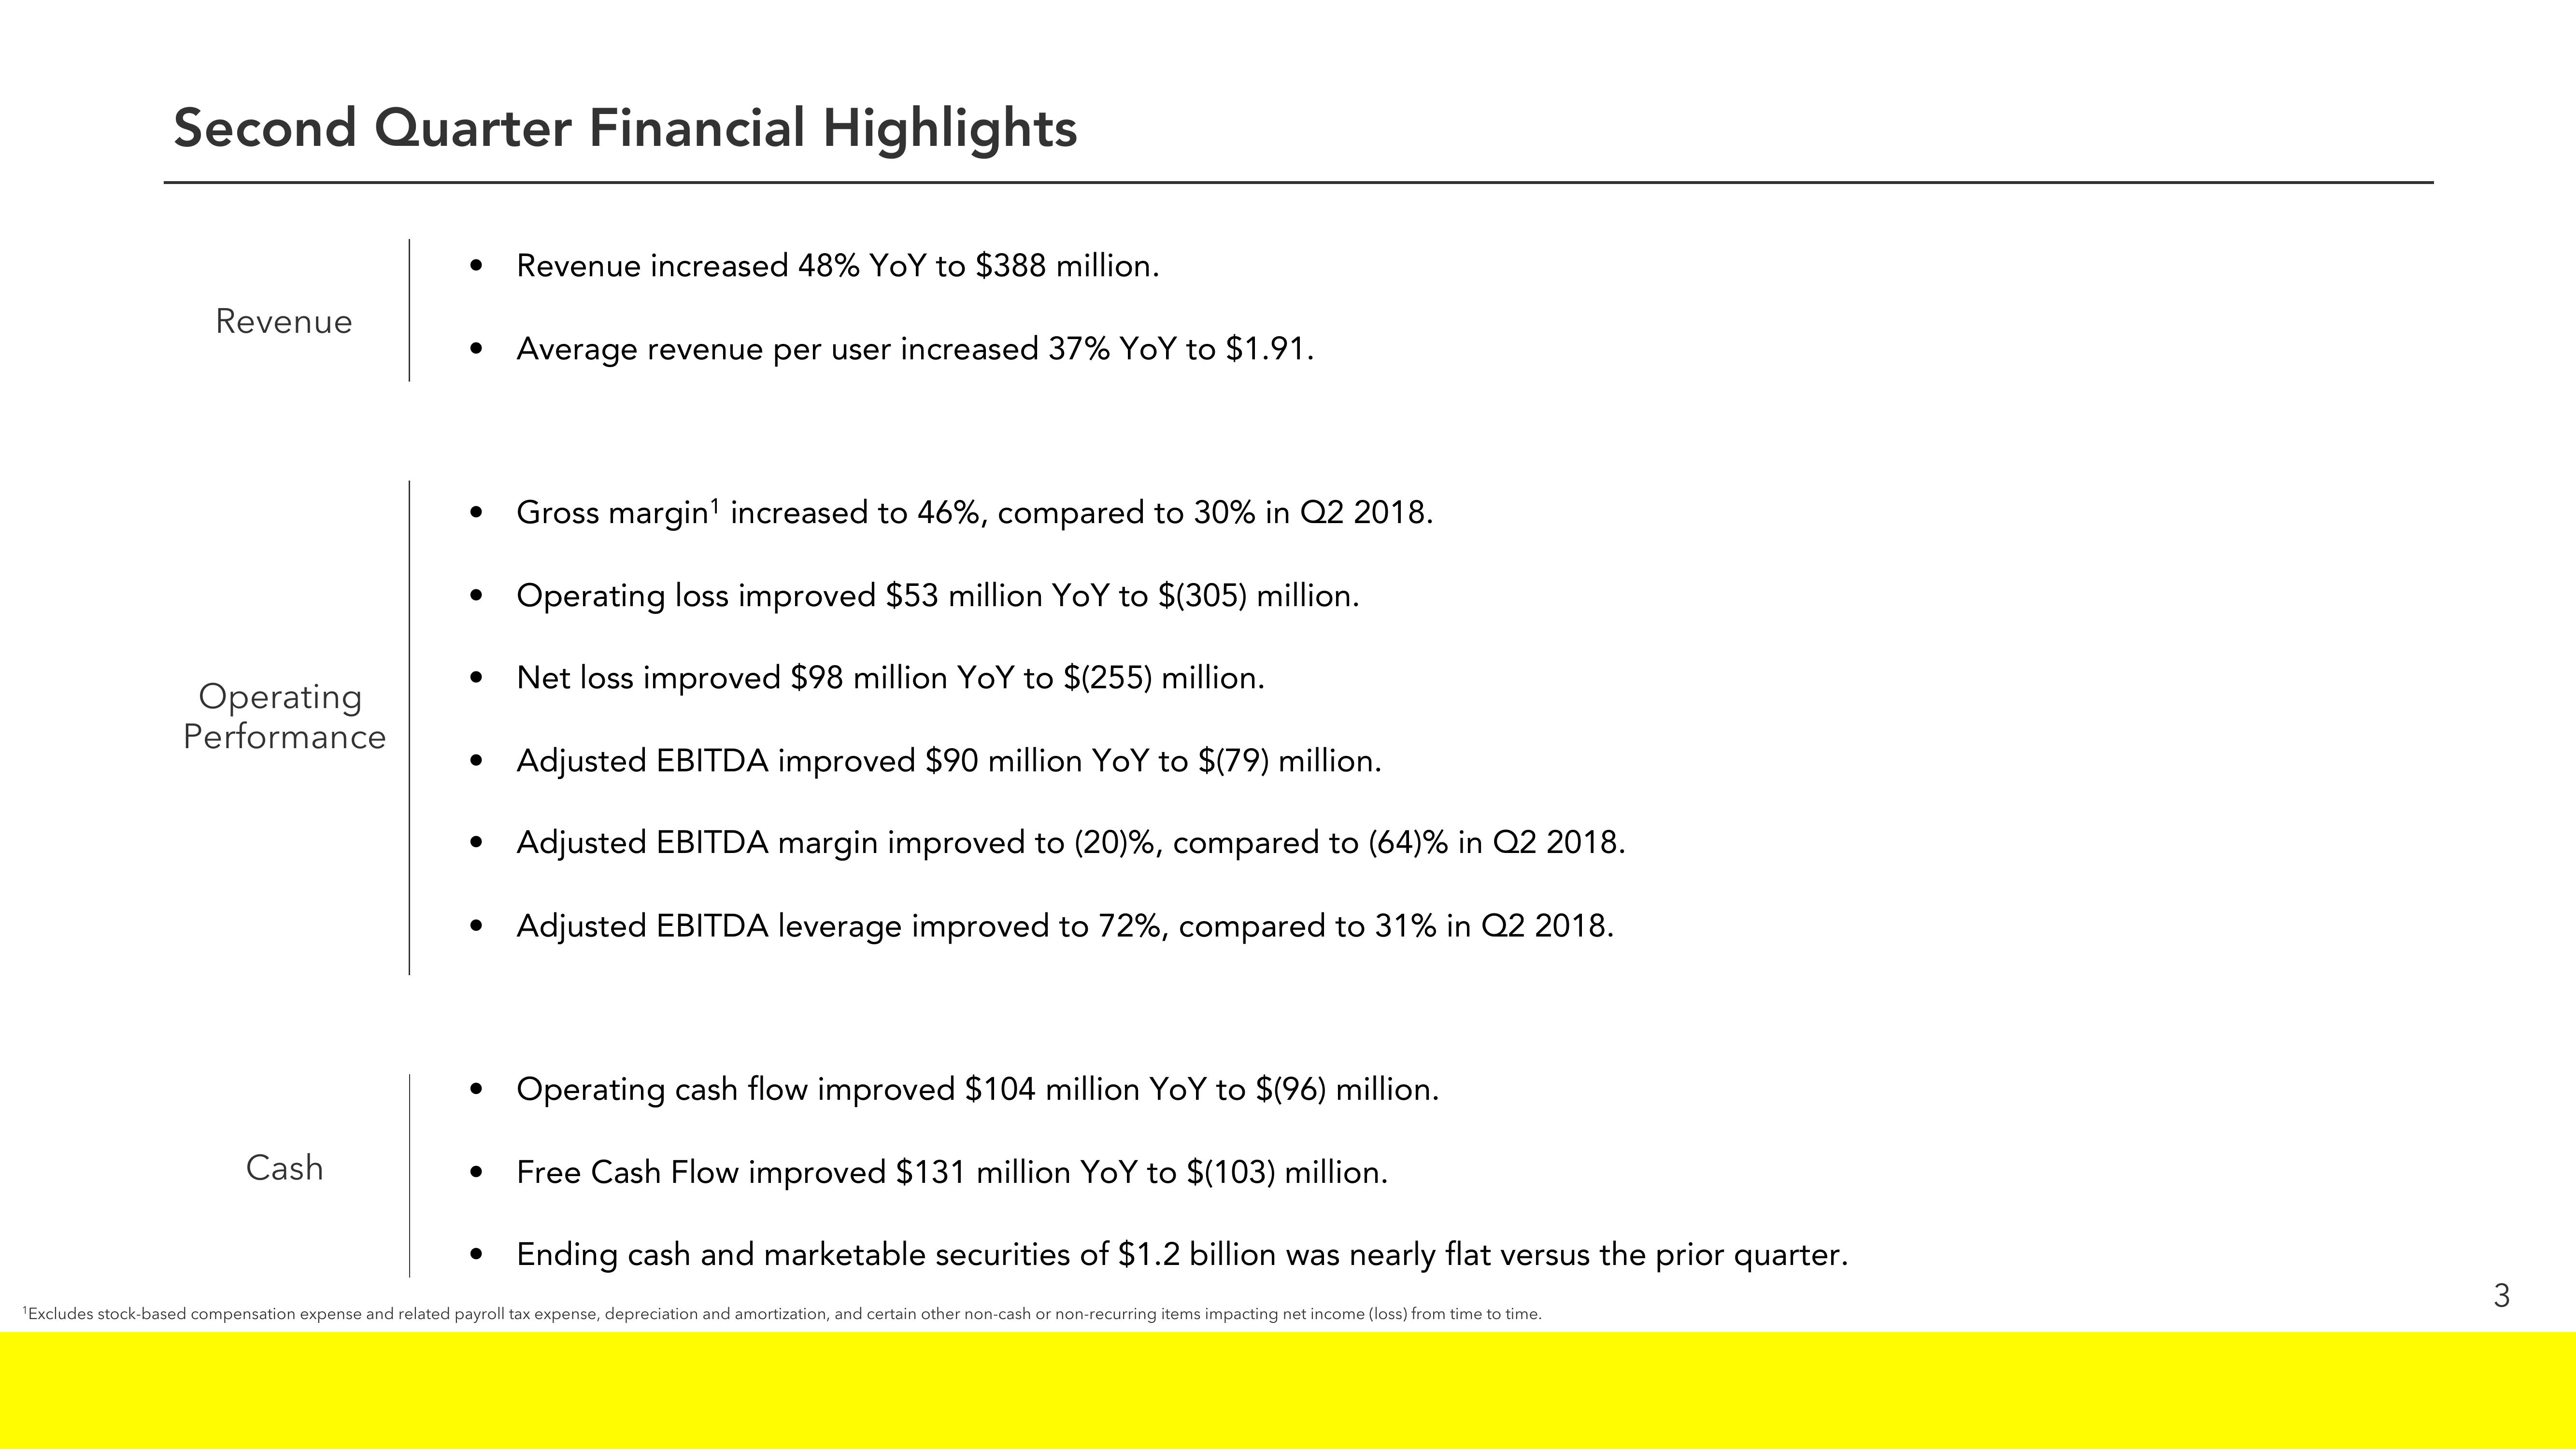
Revenue increased 48% YoY to $388 million.
●
Average revenue per user increased 37% YoY to $1.91.
Gross margin¹ increased to 46%, compared to 30% in Q2 2018.
Operating loss improved $53 million YoY to $(305) million.
Net loss improved $98 million YoY to $(255) million.
Adjusted EBITDA improved $90 million YoY to $(79) million.
Adjusted EBITDA margin improved to (20)%, compared to (64) % in Q2 2018.
Adjusted EBITDA leverage improved to 72%, compared to 31% in Q2 2018.
Operating cash flow improved $104 million YoY to $(96) million.
Free Cash Flow improved $131 million YoY to $(103) million.
• Ending cash and marketable securities of $1.2 billion was nearly flat versus the prior quarter.
¹Excludes stock-based compensation expense and related payroll tax expense, depreciation and amortization, and certain other non-cash or non-recurring items impacting net income (loss) from time to time.
3View entire presentation