Polestar Investor Presentation Deck
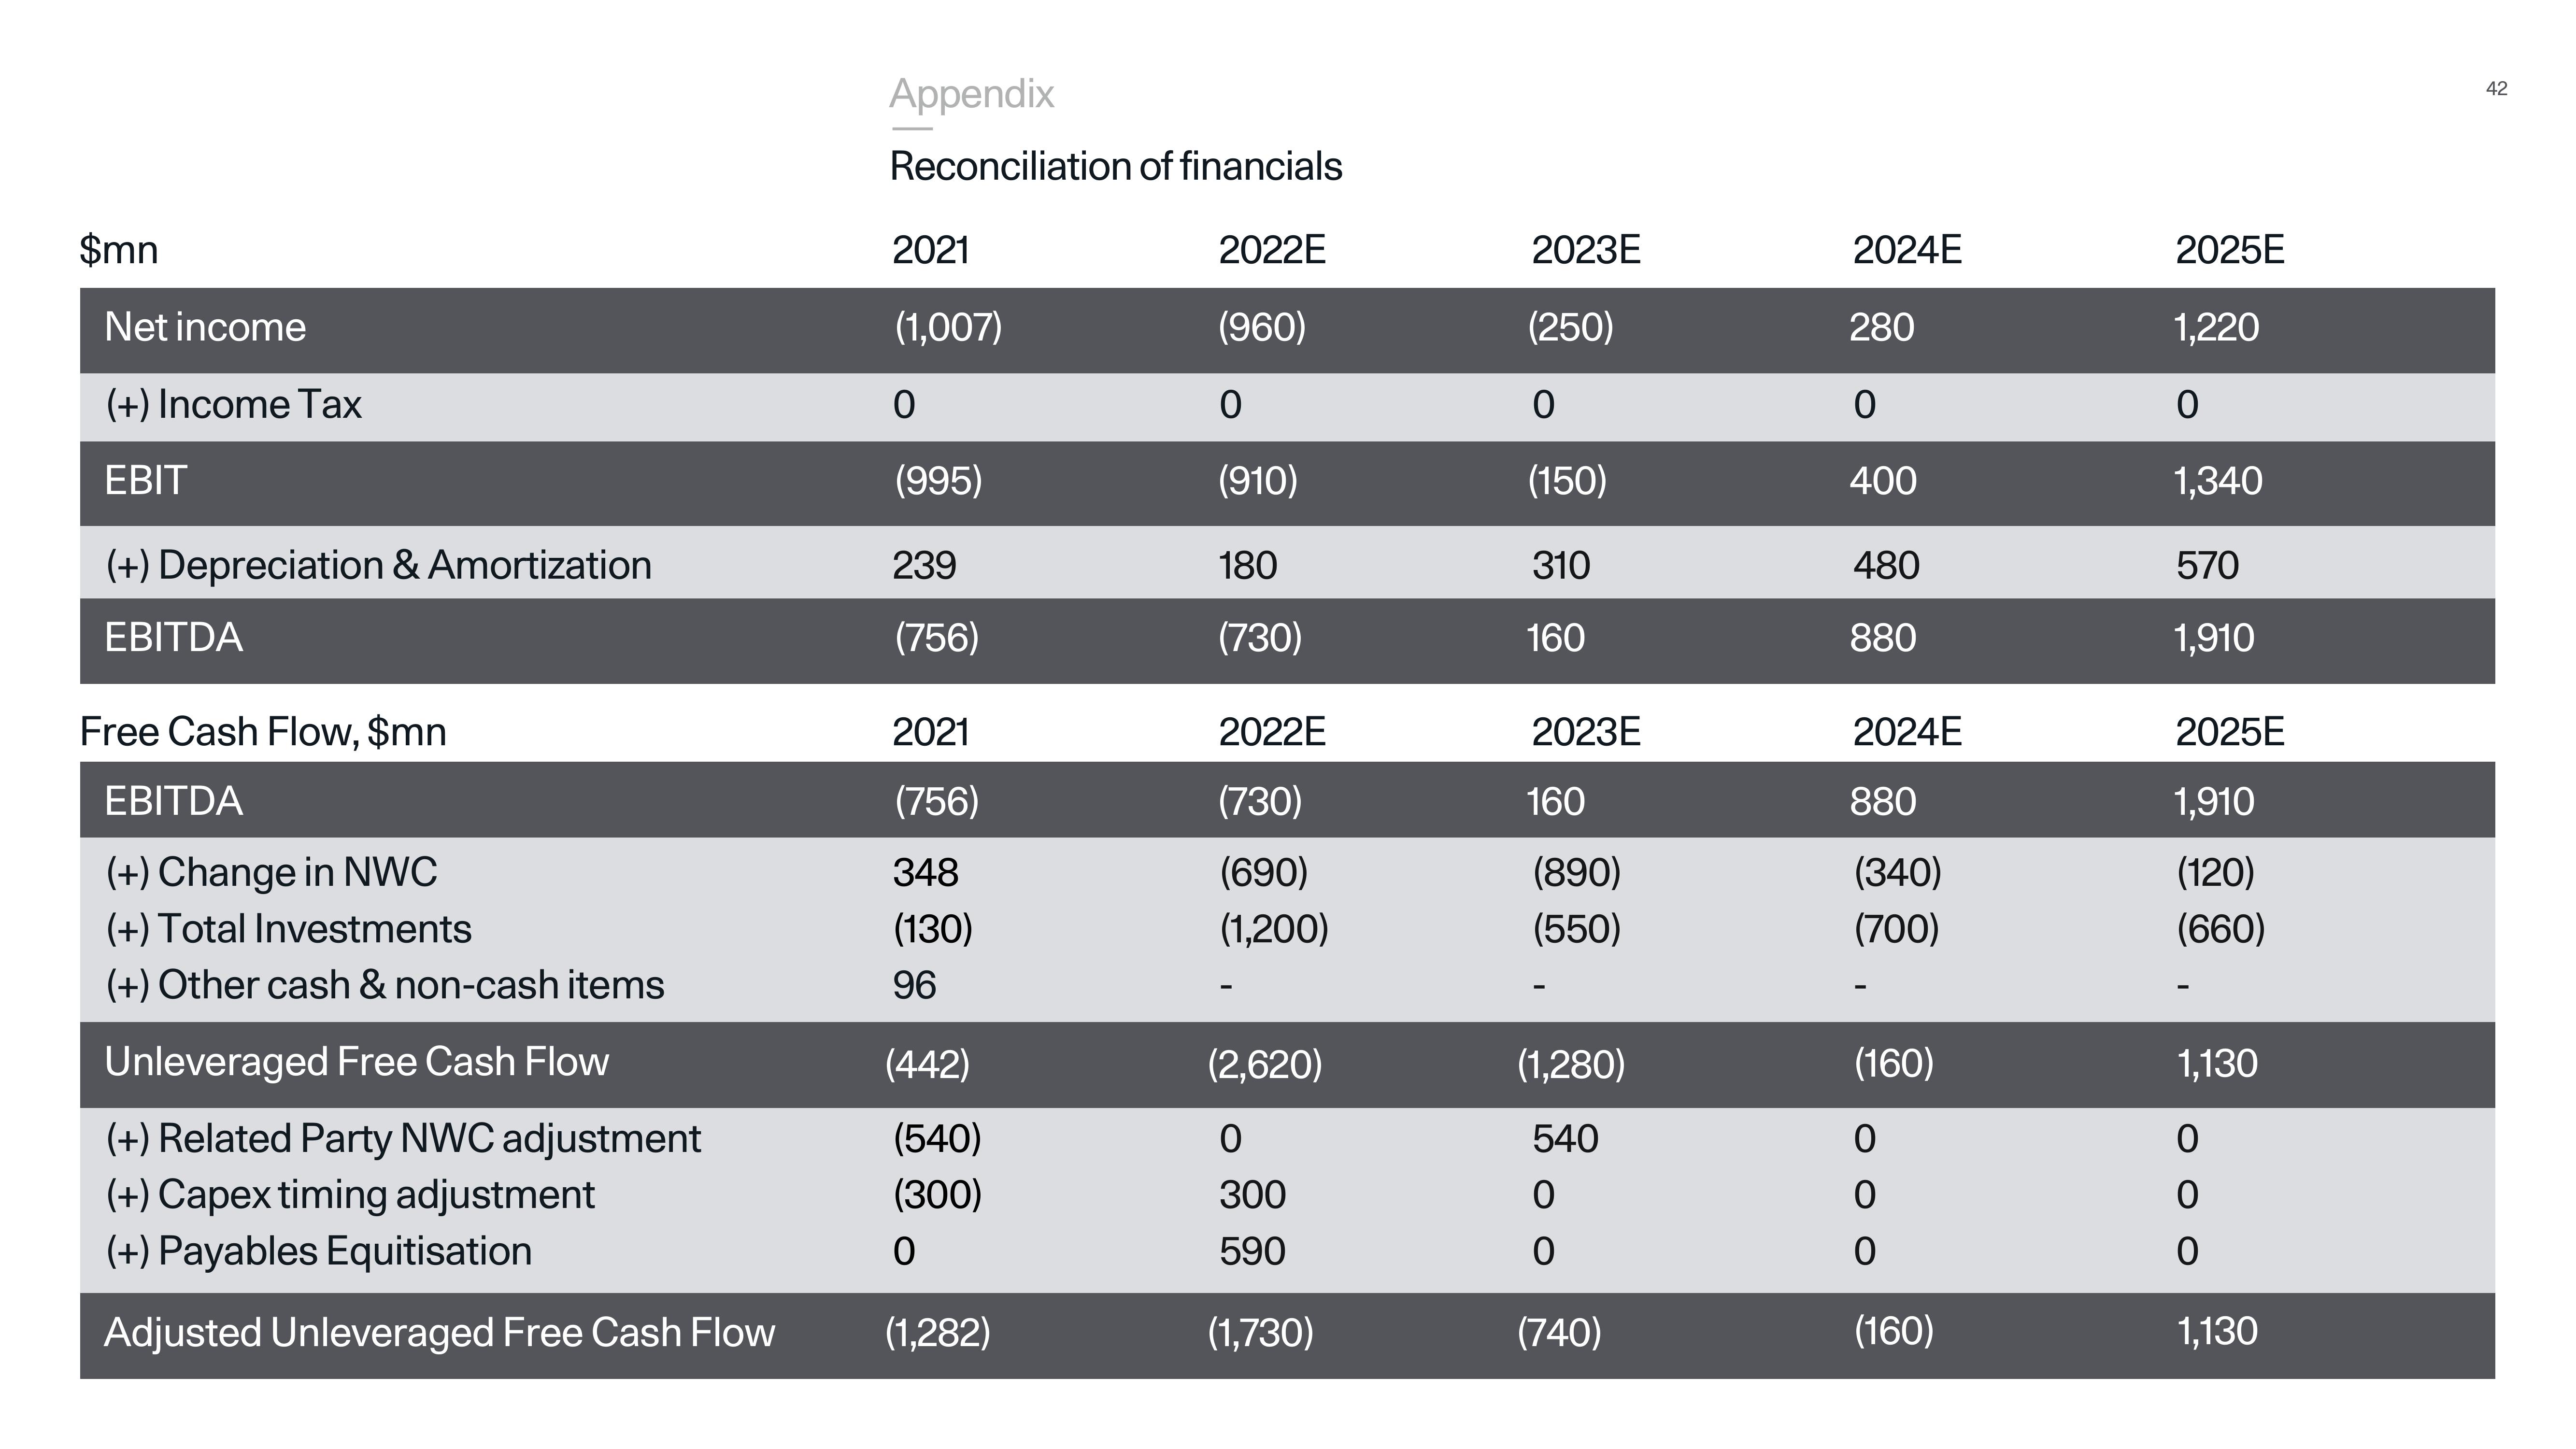
$mn
Net income
(+) Income Tax
EBIT
(+) Depreciation & Amortization
EBITDA
Free Cash Flow, $mn
EBITDA
(+) Change in NWC
(+) Total Investments
(+) Other cash & non-cash items
Unleveraged Free Cash Flow
(+) Related Party NWC adjustment
(+) Capex timing adjustment
(+) Payables Equitisation
Adjusted Unleveraged Free Cash Flow
Appendix
Reconciliation of financials
2022E
(960)
0
(910)
180
(730)
2021
(1,007)
0
(995)
239
(756)
2021
(756)
348
(130)
96
(442)
(540)
(300)
0
(1,282)
2022E
(730)
(690)
(1,200)
(2,620)
0
300
590
(1,730)
2023E
(250)
0
(150)
310
160
2023E
160
(890)
(550)
(1,280)
540
0
0
(740)
2024E
280
0
400
480
880
2024E
880
(340)
(700)
(160)
0
OO
0
0
(160)
2025E
1,220
0
1,340
570
1,910
2025E
1,910
(120)
(660)
1,130
OO
0
0
0
1,130
42View entire presentation