Investor Presentation
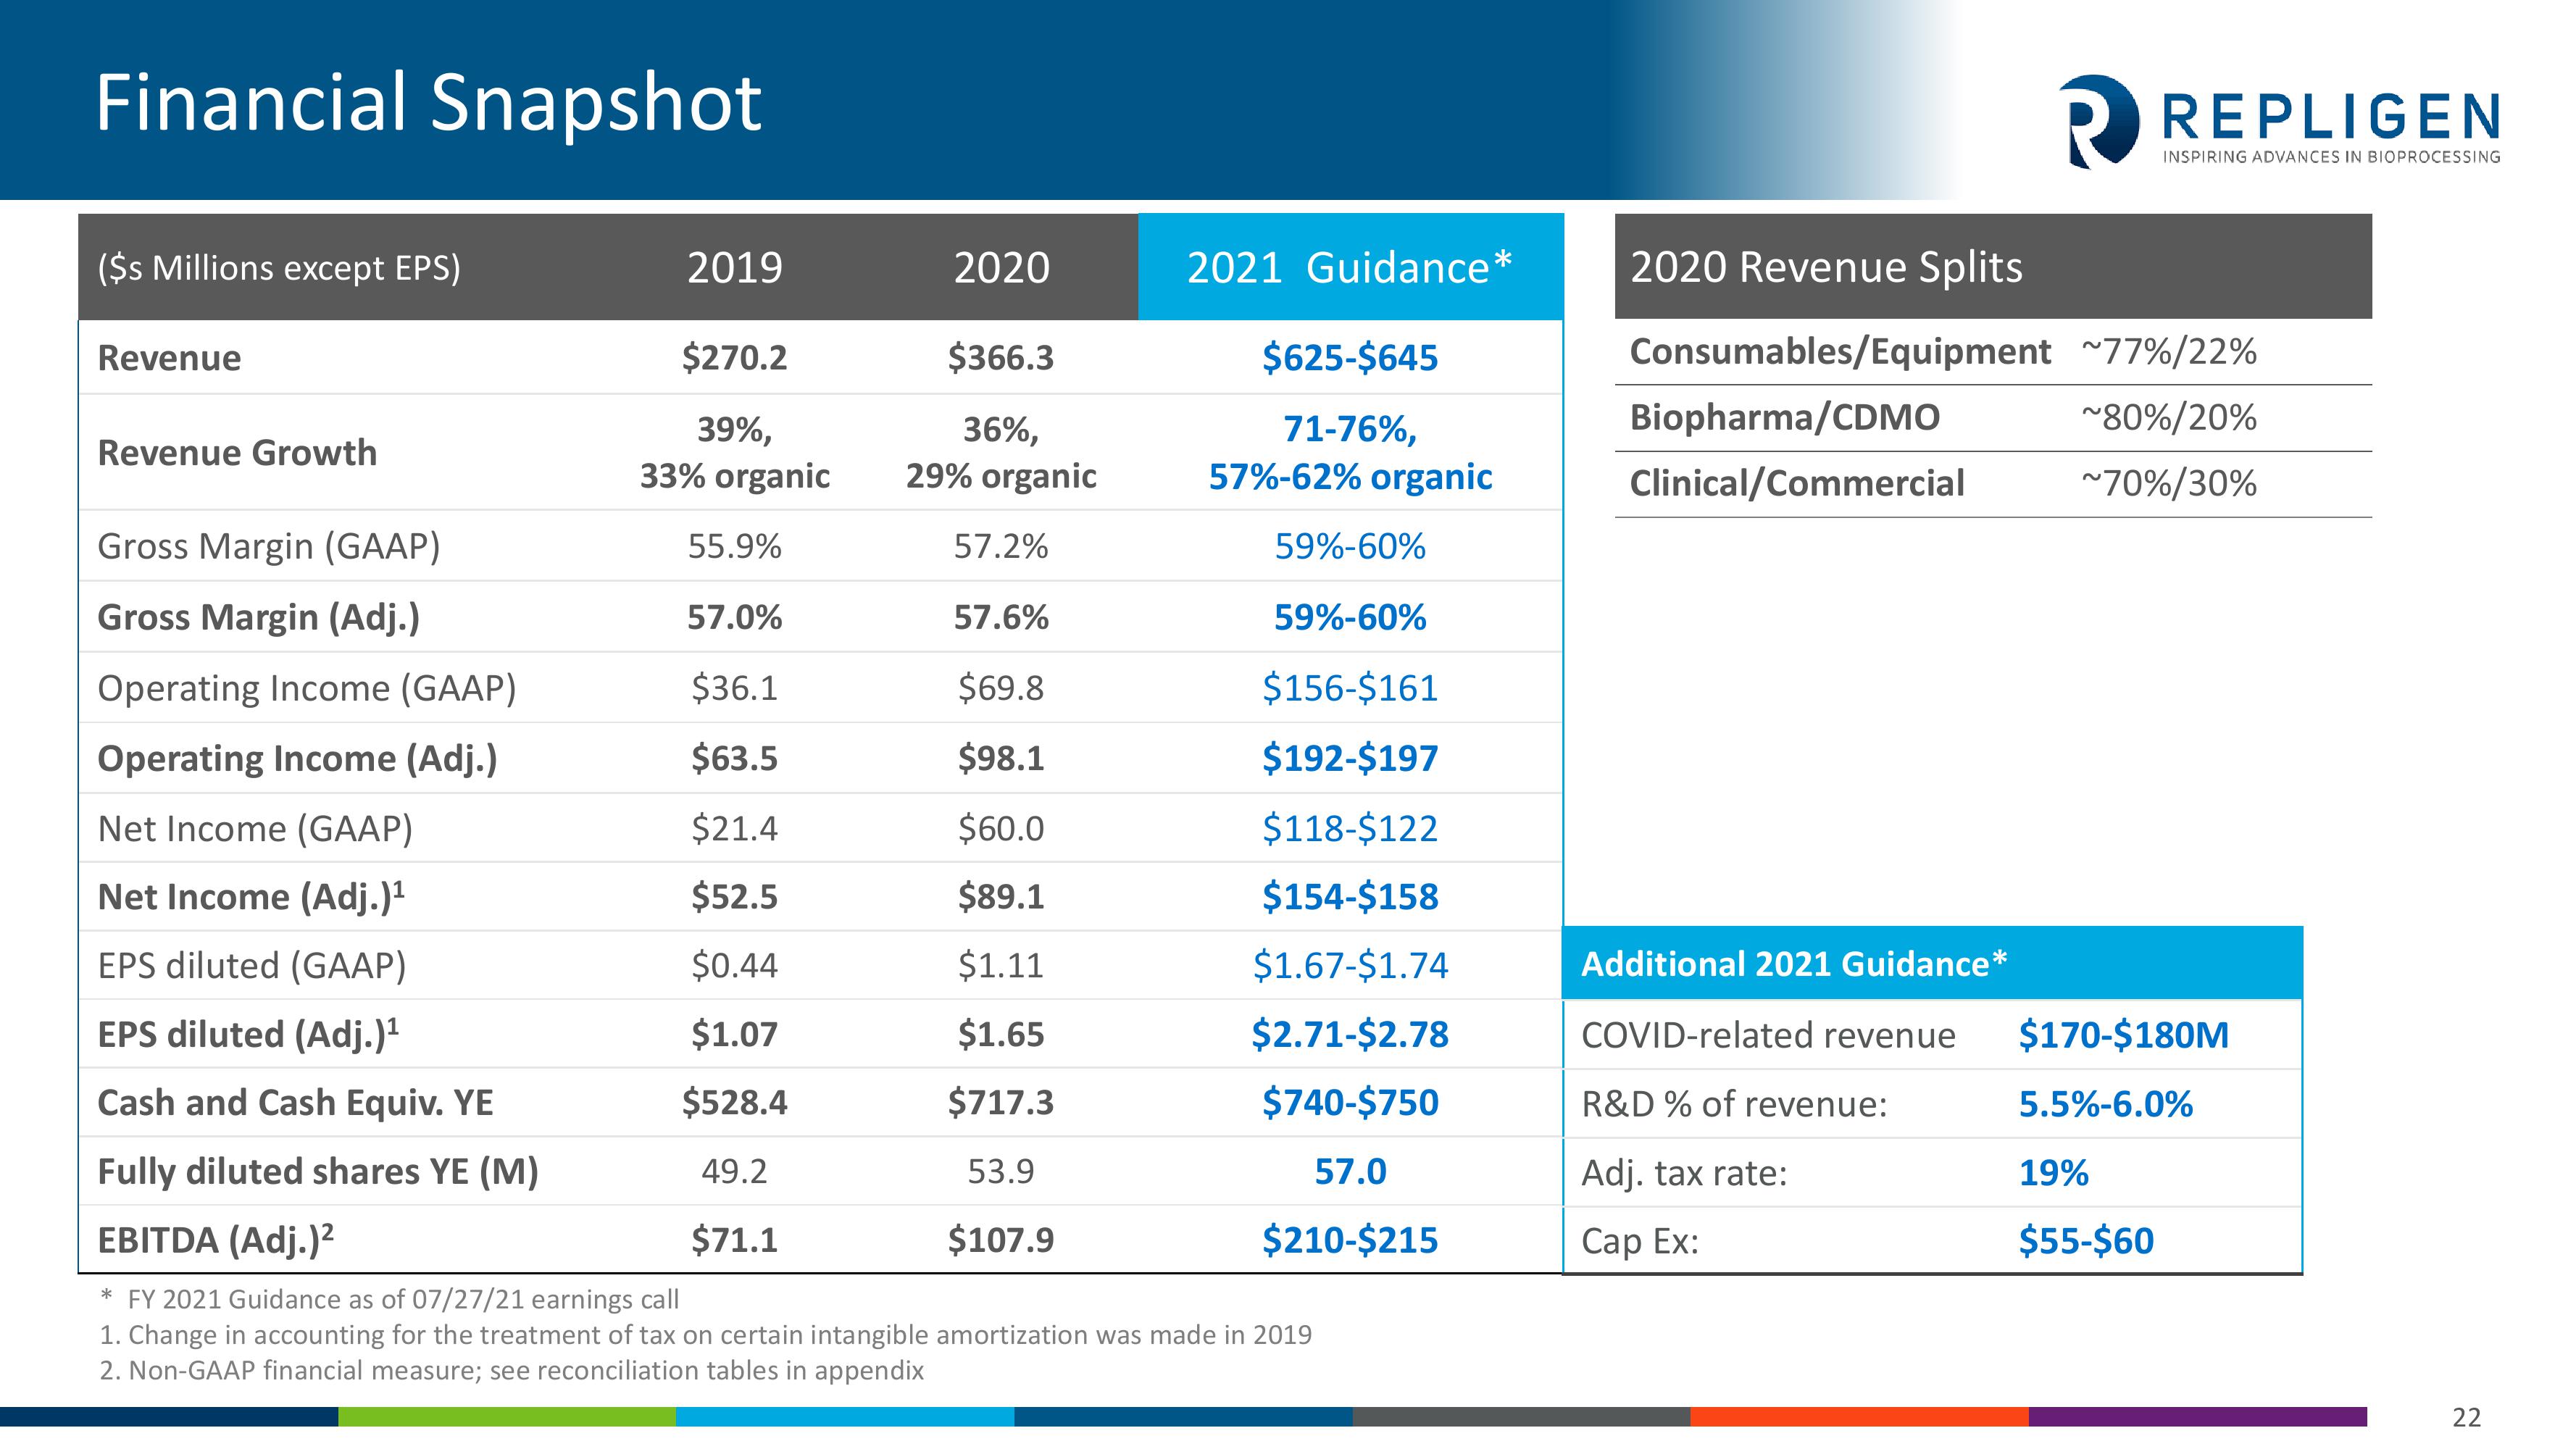
Financial Snapshot
($s Millions except EPS)
Revenue
Revenue Growth
Gross Margin (GAAP)
Gross Margin (Adj.)
2019
$270.2
39%,
33% organic
55.9%
57.0%
$36.1
$63.5
$21.4
$52.5
$0.44
$1.07
$528.4
49.2
$71.1
2020
$366.3
36%,
29% organic
57.2%
57.6%
$69.8
$98.1
$60.0
$89.1
$1.11
$1.65
$717.3
53.9
$107.9
2021 Guidance*
$625-$645
71-76%,
57%-62% organic
59%-60%
59%-60%
$156-$161
$192-$197
$118-$122
$154-$158
$1.67-$1.74
$2.71-$2.78
$740-$750
57.0
$210-$215
Operating Income (GAAP)
Operating Income (Adj.)
Net Income (GAAP)
Net Income (Adj.)¹
EPS diluted (GAAP)
EPS diluted (Adj.)¹
Cash and Cash Equiv. YE
Fully diluted shares YE (M)
EBITDA (Adj.)²
* FY 2021 Guidance as of 07/27/21 earnings call
1. Change in accounting for the treatment of tax on certain intangible amortization was made in 2019
2. Non-GAAP financial measure; see reconciliation tables in appendix
2020 Revenue Splits
Consumables/Equipment ~77%/22%
~80%/20%
~70%/30%
Biopharma/CDMO
Clinical/Commercial
RREPLIGEN
INSPIRING ADVANCES IN BIOPROCESSING
Additional 2021 Guidance*
COVID-related revenue
R&D % of revenue:
Adj. tax rate:
Cap Ex:
$170-$180M
5.5%-6.0%
19%
$55-$60
22View entire presentation