OppFi Results Presentation Deck
18
Balance Sheet Highlights
($ in 000s)
Assets
Cash and restricted cash
Finance Receivables at Fair
Value
Finance Receivables at
Amortized Cost, Net
Other Assets
Total Assets
Liabilities and Members'
Equity
Current Liabilities
Total Debt
Total Liabilities
Total Equity
Total Liabilities and Equity
Unaudited
6/30/2021
$120,779
296,381
132
19,943
$437,235
$29,249
230,647
$259,896
177,339
$437,235
12/31/2020
$45,657
222,243
17,943
$285,843
$28,406
158, 105
$186,511
99,332
$285,843
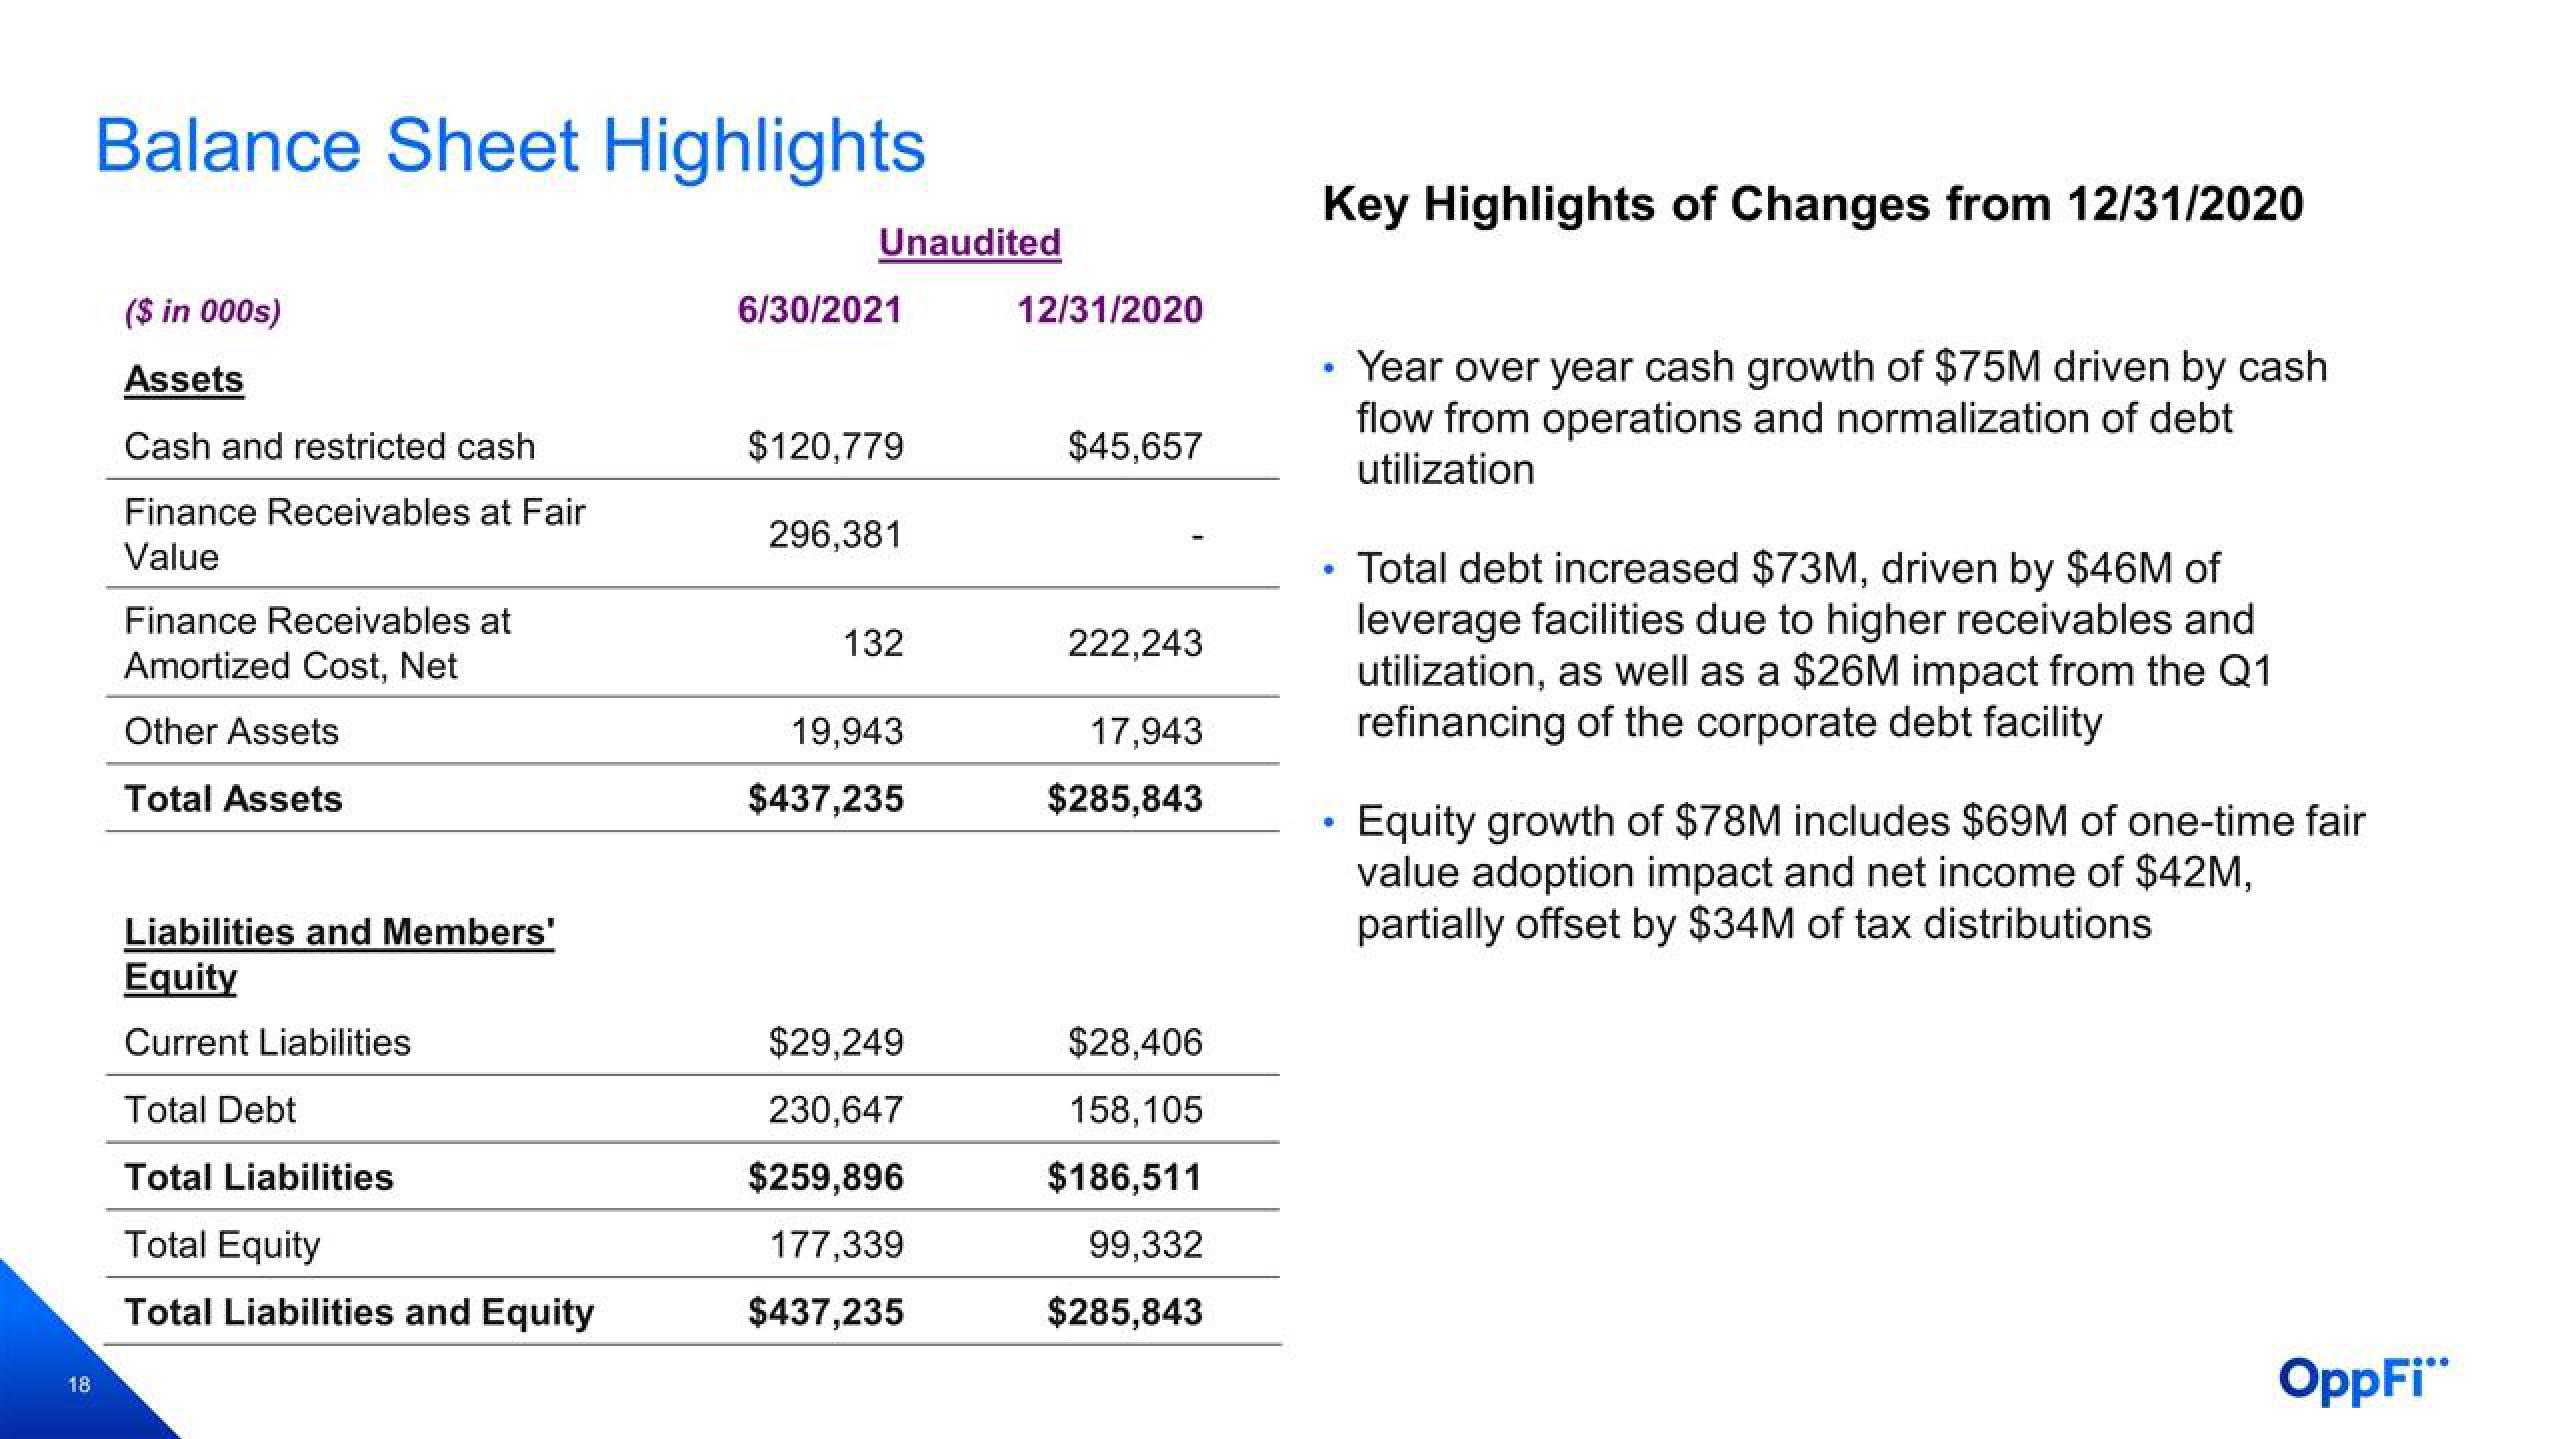
Key Highlights of Changes from 12/31/2020
Year over year cash growth of $75M driven by cash
flow from operations and normalization of debt
utilization
• Total debt increased $73M, driven by $46M of
leverage facilities due to higher receivables and
utilization, as well as a $26M impact from the Q1
refinancing of the corporate debt facility
Equity growth of $78M includes $69M of one-time fair
value adoption impact and net income of $42M,
partially offset by $34M of tax distributions
OppFi"View entire presentation