Hydrafacial Investor Conference Presentation Deck
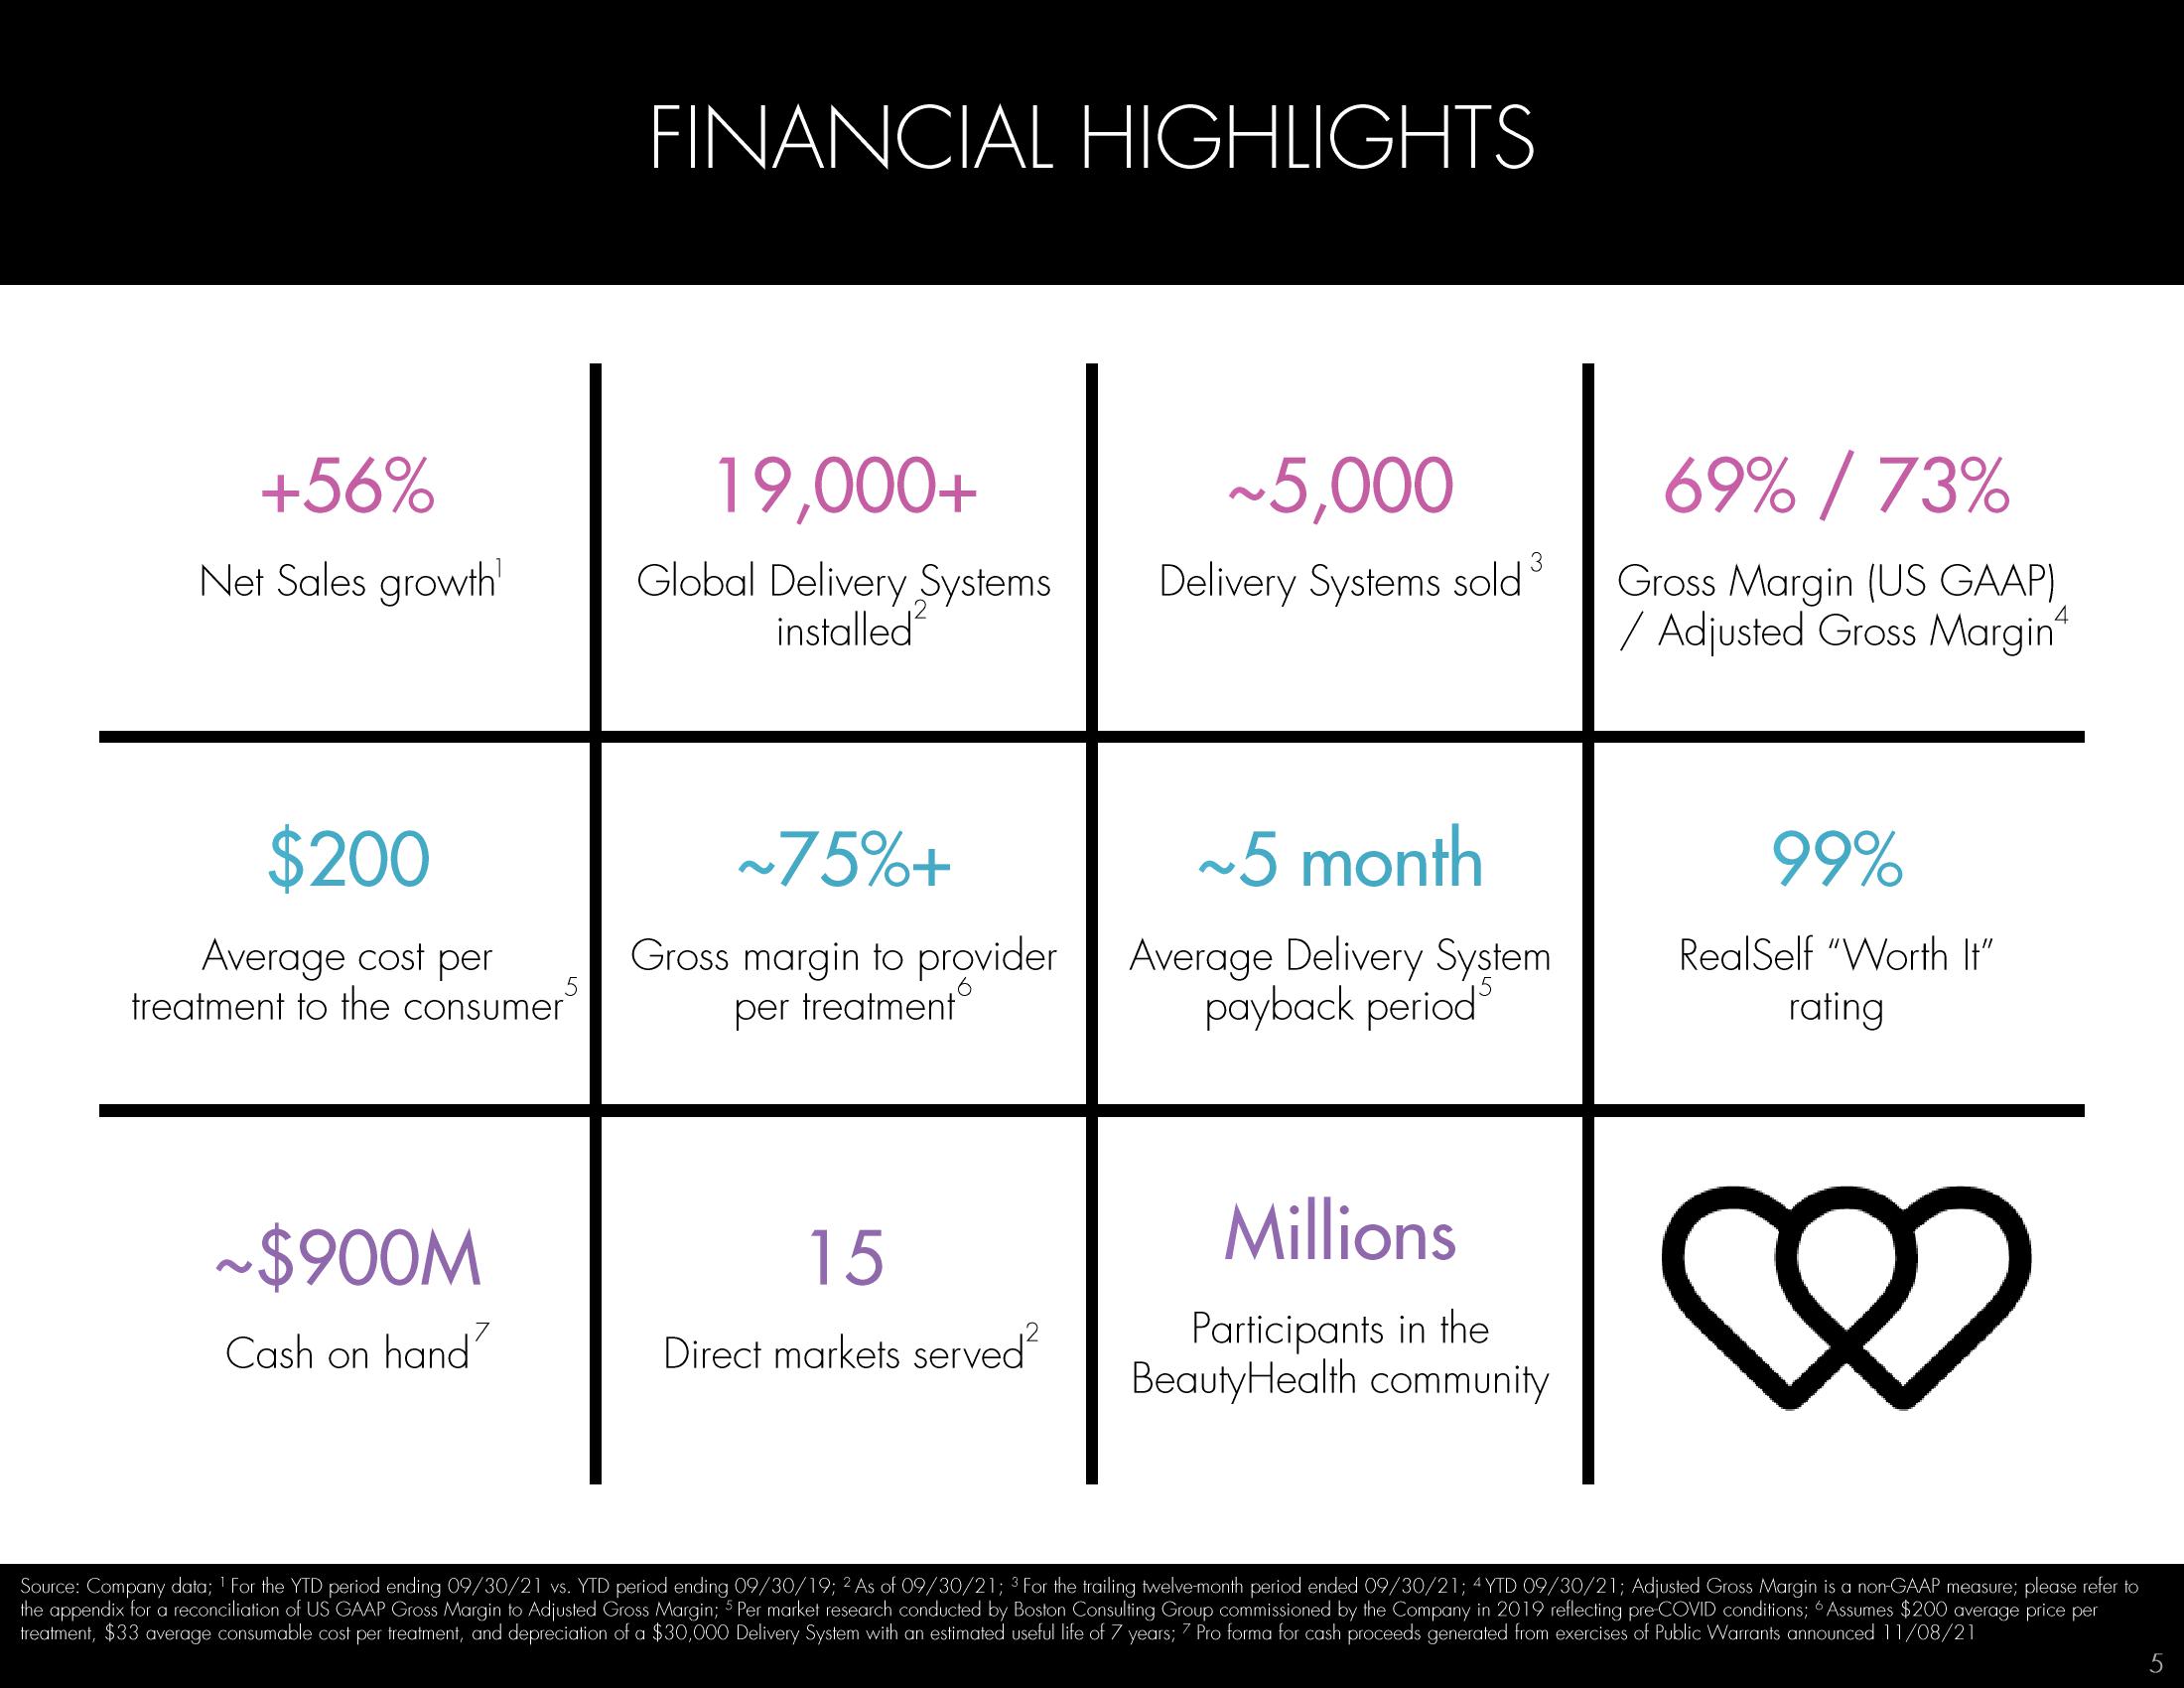
+56%
Net Sales growth'
$200
Average cost per
treatment to the consumer³
~$900M
Cash on hand?
FINANCIAL HIGHLIGHTS
19,000+
Global Delivery Systems
installed
~75%+
Gross margin to provider
per treatment
15
Direct markets served²
~5,000
3
Delivery Systems sold
~5 month
Average Delivery System
payback period
Millions
Participants in the
BeautyHealth community
69%/73%
Gross Margin (US GAAP)
/ Adjusted Gross Margin
99%
RealSelf "Worth It"
rating
♡
Source: Company data; ¹ For the YTD period ending 09/30/21 vs. YTD period ending 09/30/19; 2 As of 09/30/21; 3 For the trailing twelve-month period ended 09/30/21; 4YTD 09/30/21; Adjusted Gross Margin is a non-GAAP measure; please refer to
the appendix for a reconciliation of US GAAP Gross Margin to Adjusted Gross Margin; 5 Per market research conducted by Boston Consulting Group commissioned by the Company in 2019 reflecting pre-COVID conditions; Assumes $200 average price per
treatment, $33 average consumable cost per treatment, and depreciation of a $30,000 Delivery System with an estimated useful life of 7 years; 7 Pro forma for cash proceeds generated from exercises of Public Warrants announced 11/08/21
5View entire presentation