BlackRock Results Presentation Deck
7%
7%
$81
Q4
2017
6%
$55
7%
$55
Q1
2018
19% 15%
$35
4%
BlackRock.
4%
$14
Q2
2018
10%
$18
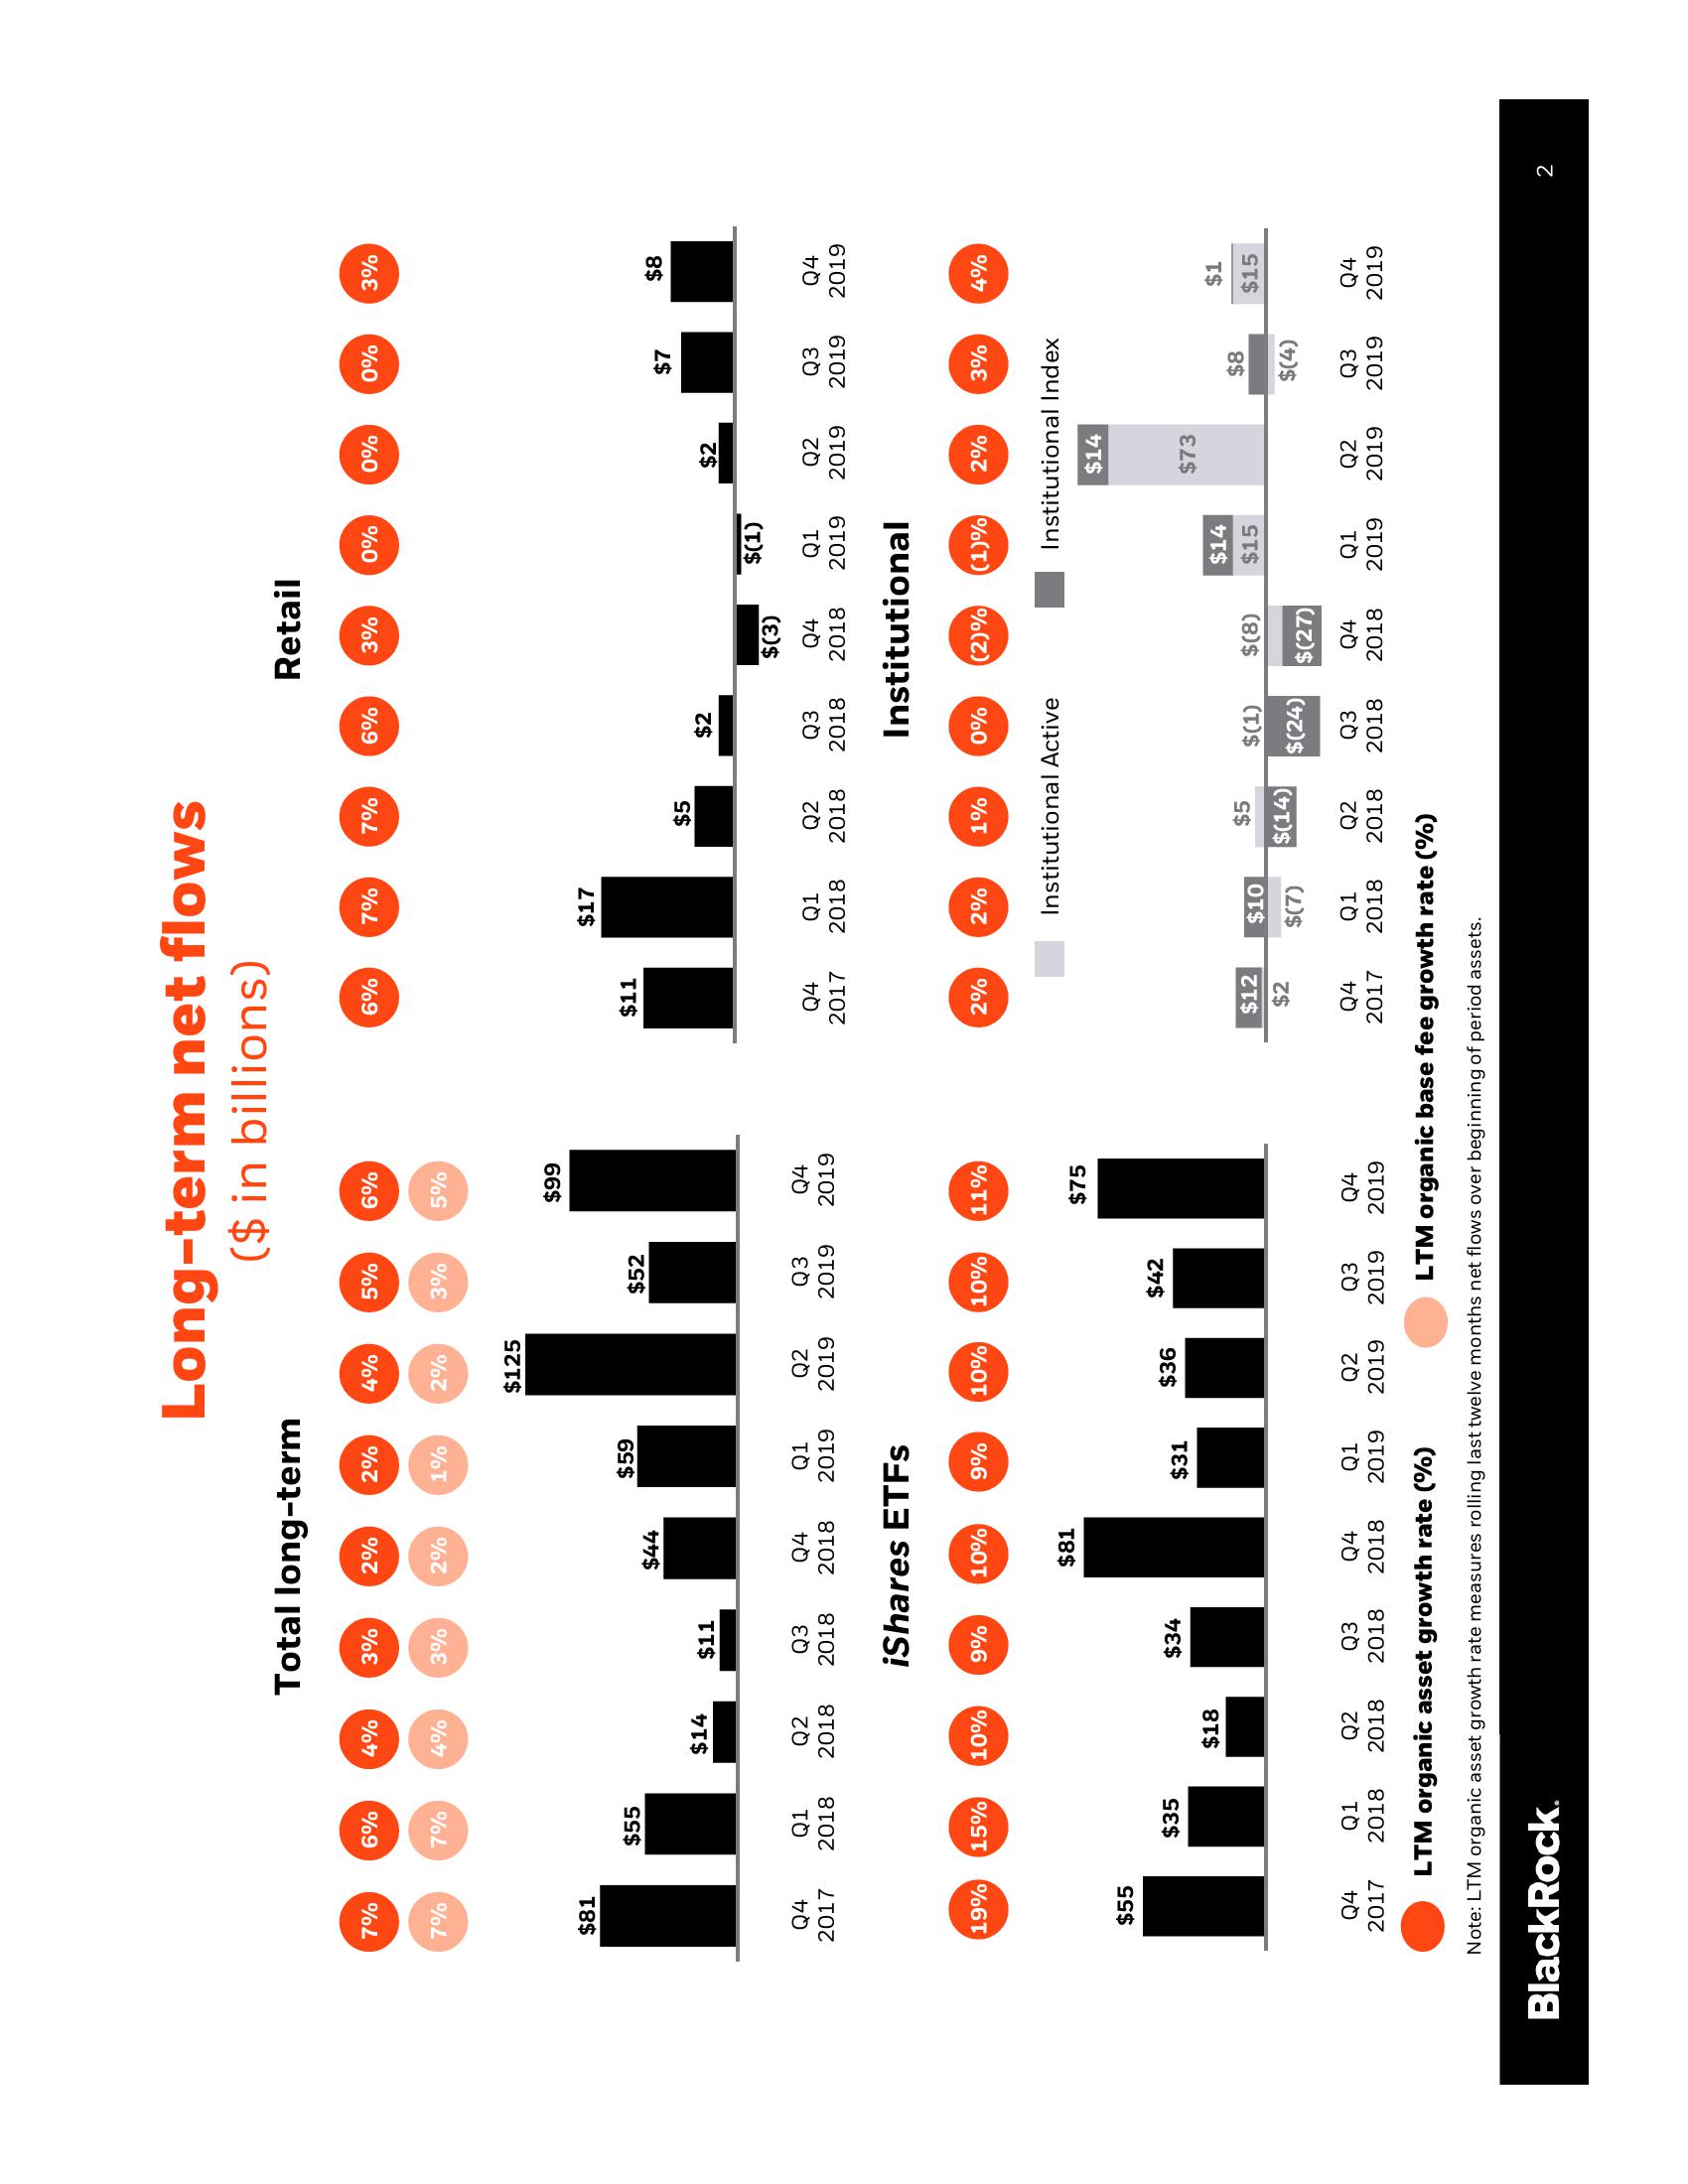
Total long-term
3%
3%
$11
2%
9%
2%
$34
$44
Q3
Q4 Q1
2018 2018 2019
2%
iShares ETFs
10%
1%
$81
$59
9%
Long-term net flows
($ in billions)
$31
4%
2%
$125
Q2
2019
10%
$36
5%
Q2
2019
3%
$52
Q3
2019
$42
6%
5%
Q3
2019
$99
10% 11%
Q4
2019
$75
6%
$11
Q4
2017
2%
$12
$2
7%
Q4
2017
$17
2%
7%
Q1
Q2
2018 2018
$5
$10
$(7)
Q4
Q2
Q3
Q4
Q1
Q1
2017 2018 2018 2018 2018 2019
Q4
2019
Q1 Q2
2018 2018
LTM organic asset growth rate (%)
LTM organic base fee growth rate (%)
Note: LTM organic asset growth rate measures rolling last twelve months net flows over beginning of period assets.
1%
$5
$(14)
6%
$2
Institutional Active
0%
Retail
3%
$(3)
Q3 Q4
2018 2018
Institutional
Q3
2018
(2)%
$(1) $(8)
$(24)
0%
$(27)
Q4
2018
$(1)
Q1
2019
(1)%
0%
$14
$15
$2
2%
0%
$7
$73
Q2
Q3
Q4
2019 2019 2019
Institutional Index
$14
3%
$8
3%
$(4)
$8
4%
$1
$15
Q1
Q2
Q3
Q4
2019 2019 2019 2019
2View entire presentation