Barclays Investment Banking Pitch Book
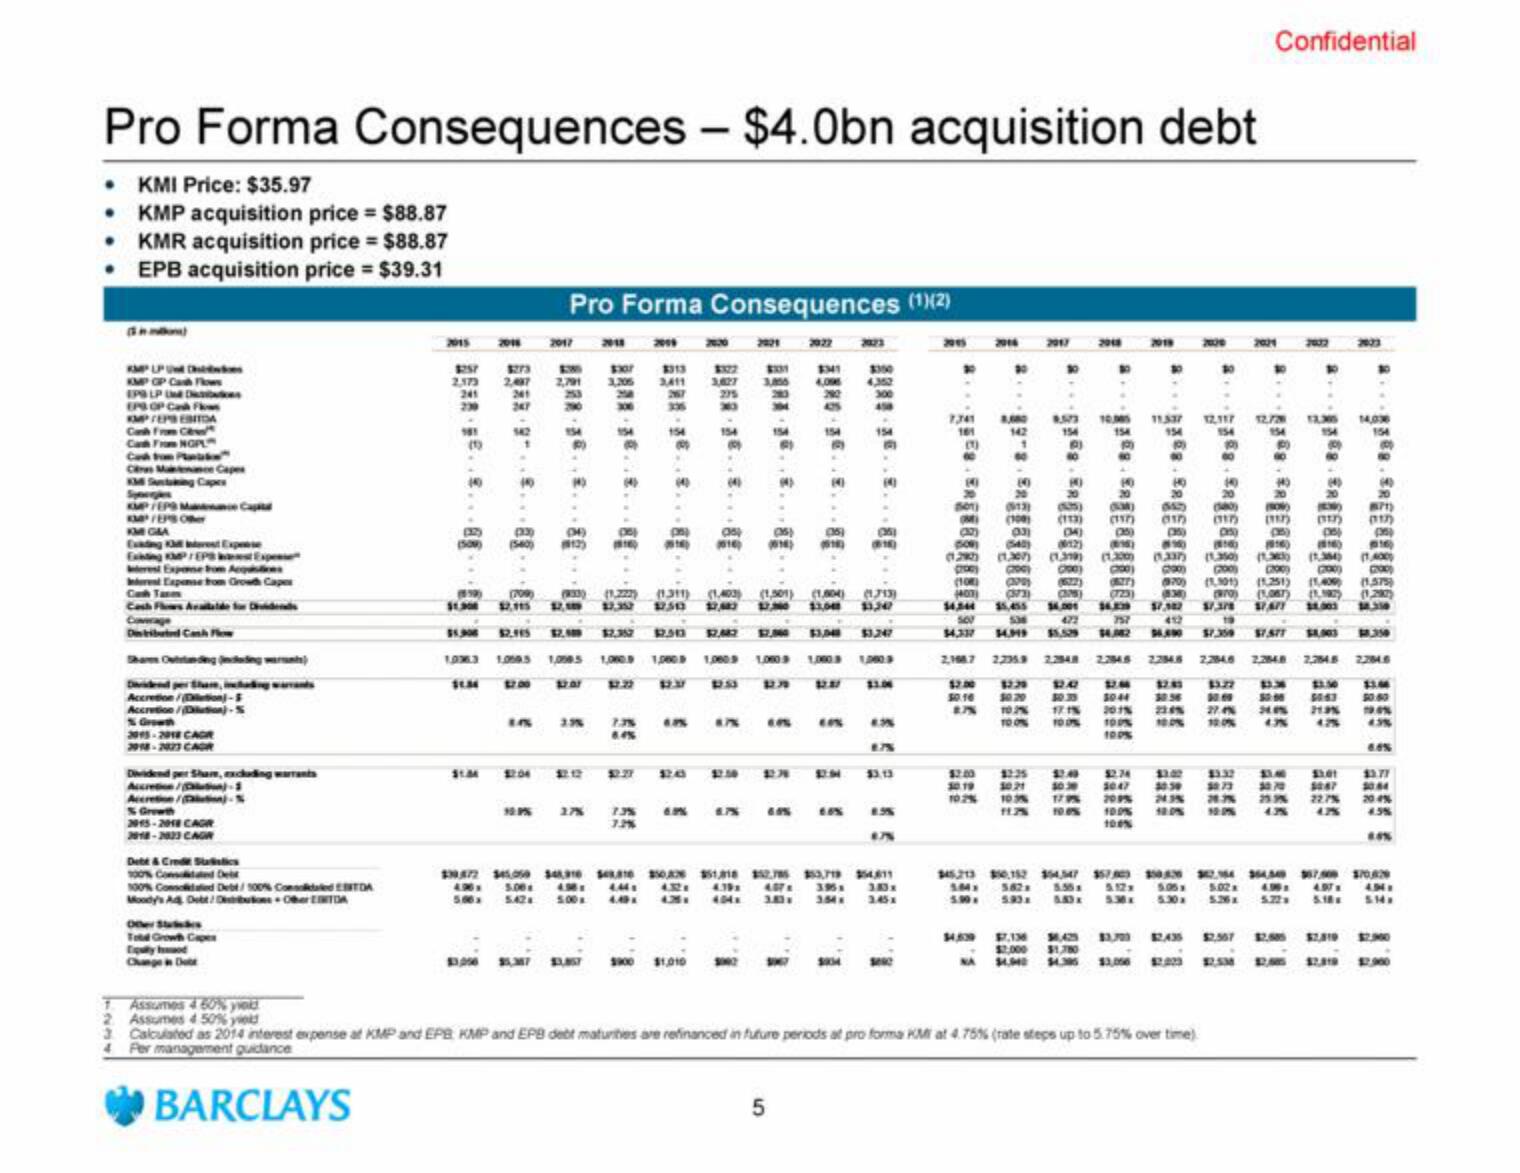
Pro Forma Consequences - $4.0bn acquisition debt
• KMI Price: $35.97
• KMP acquisition price = $88.87
• KMR acquisition price = $88.87
• EPB acquisition price = $39.31
KMP UP U kes
KMP GP Cash Flows
EPS LP
EPS OP Cash F
KMP/EPB EBITDA
Des
Cash From C
Cash From NGPL
Cash From P
C
KM Sting Capes
Menance Cape
Spoerges
KMP/EPS Man Capital
KM/EPS Or
KM GIA
Existing KP/EPS
Expense
rest Expone from Acquisitions
est Expense from Growth Caper
Cash Tar
Coverage
Distributed Cash Flow
Accretion/Dion-
Accretion/Dution)-5
% Growth
2015-2018 CAR
2018-2023 CAGR
Accretion/n)-1
Accretion/tin-
% Growth
2015-2018 CAGR
2018-2023 CAGN
Det & Credit Suistics
100% Consted De
100% Consoldated Debt/100% Conded TA
Moody's Ad Debt/sbons OberENTDA
Other Stud
To Grow Capes
Th
Change in D
Assumes 4 60% yold
Assumes 4 50% yield
2015
2,173
241
(509)
(819)
$1,300
10363
$1.34
Pro Forma Consequences (¹)(2)
9
2017
1773
2,487 2,791 3,205
201
247
300
R
2011
3.3%
$1.34 12:04 £2.12
2011
7.3%
3,411
267
336
7.2%
1,080.9 1,000 B 1,0609
6.P%
130472 $45.00 4310 5410 350
490x 5.00 4.98 LM:
500x 5.42 5.00
4.0
3322 2331
3,627 3,855
275
(933) (1,222) (1311) (1,403) (1,501) (1,004) (1793)
12,115 12,109 $7,352 1230 17,683 17,300 $1,000 11,307
$2.445 $2.500 $2,352 12.303
$3,247
1,000.9
1,000 5
113,056 $5,347 13.857 3900 $1,010
2021
$2,482
$7,040
1,000 9
2022
(16) (618)
$M1
4,096 4,352
CPS
5
435
$3,000
300
450
1,000 B
(16)
43%
$3.13
8.5%
351318 $52,785 $53,719 $54811
4.39x 40TA 395 183x
404x 3.83
354x
7,341 8,080 8.573
161
501)
OM
1
(32)
DOR
2017
80
140
2018
10,005
2019
(0)
$
$4,59 1.13
$2,000 $1,780
$4.395
$4.40
(4)
BPT)
(117) (117) (117)
(15)
crasy
(108)
(540) (012) (695) 8160 1816 816)
(1,307) (1319) (1.300) (1.2335)
(136) (1,36)
(200) 200) (700) (290) (200) (2000) (200) GOO
(329) (622) OSNEP) (1970) (1,901) (1,251) (1,400) (1,575)
(403) (373) (325) (723) (830) (wo) (1,067)
(122)
14,244 $5,455 34,001
$7,382 57.378 STAFF
500
422
757
$4,337 14.39 $5.529 14,42
2,198.7 2.235.9 2.2948 2.254.5
18.310
19
$4,400 $7.359 SISTT $4,003
22846 2,284.8 2,284.5
20
(913) (5635) (M) (42)
(100) (113) (117) (17)
11.337 12,117 12.778 13365
22348
50.16 $0.20 30.35 30.44 30.56
5 TO2% 17.1% 20.1% 224%
100% 100%
100%
1
345,213 $50.152 354,547 $57.00 50.53
1.84 582 5.55 512x 5.05
5.90 5.93 583x 530x 530x
Calculated as 2014 interest expense at KMP and EPB, KMP and EPB debt maturities are refinanced in future periods at pro forma KM at 4.75% (rate steps up to 5.75% over time)
Per management guidance
BARCLAYS
Confidential
a
(180)
$2.74
12:35
11.01
30.19 10.21 10.30 30.47 30.50 30.73 30.70 5047
10.2% 10.3% 17.95 20.9% 243% 28.3% 25.3% 22.7%
11.7%
10.0% 12.05
100%
(4)
14,036
000
354.540 367.50
5.02
4.97
526x 5.22 5.1
$8,350
$1.50
$1.M
30.6 5000 5063 50.60
27.4% 24.05 2135
(
475
2284.6
4.3%
6.4%
$3.77
30.64
20.4%
4.3%
80%
$70.829
494
SM
$2,900View entire presentation