GlobalFoundries Results Presentation Deck
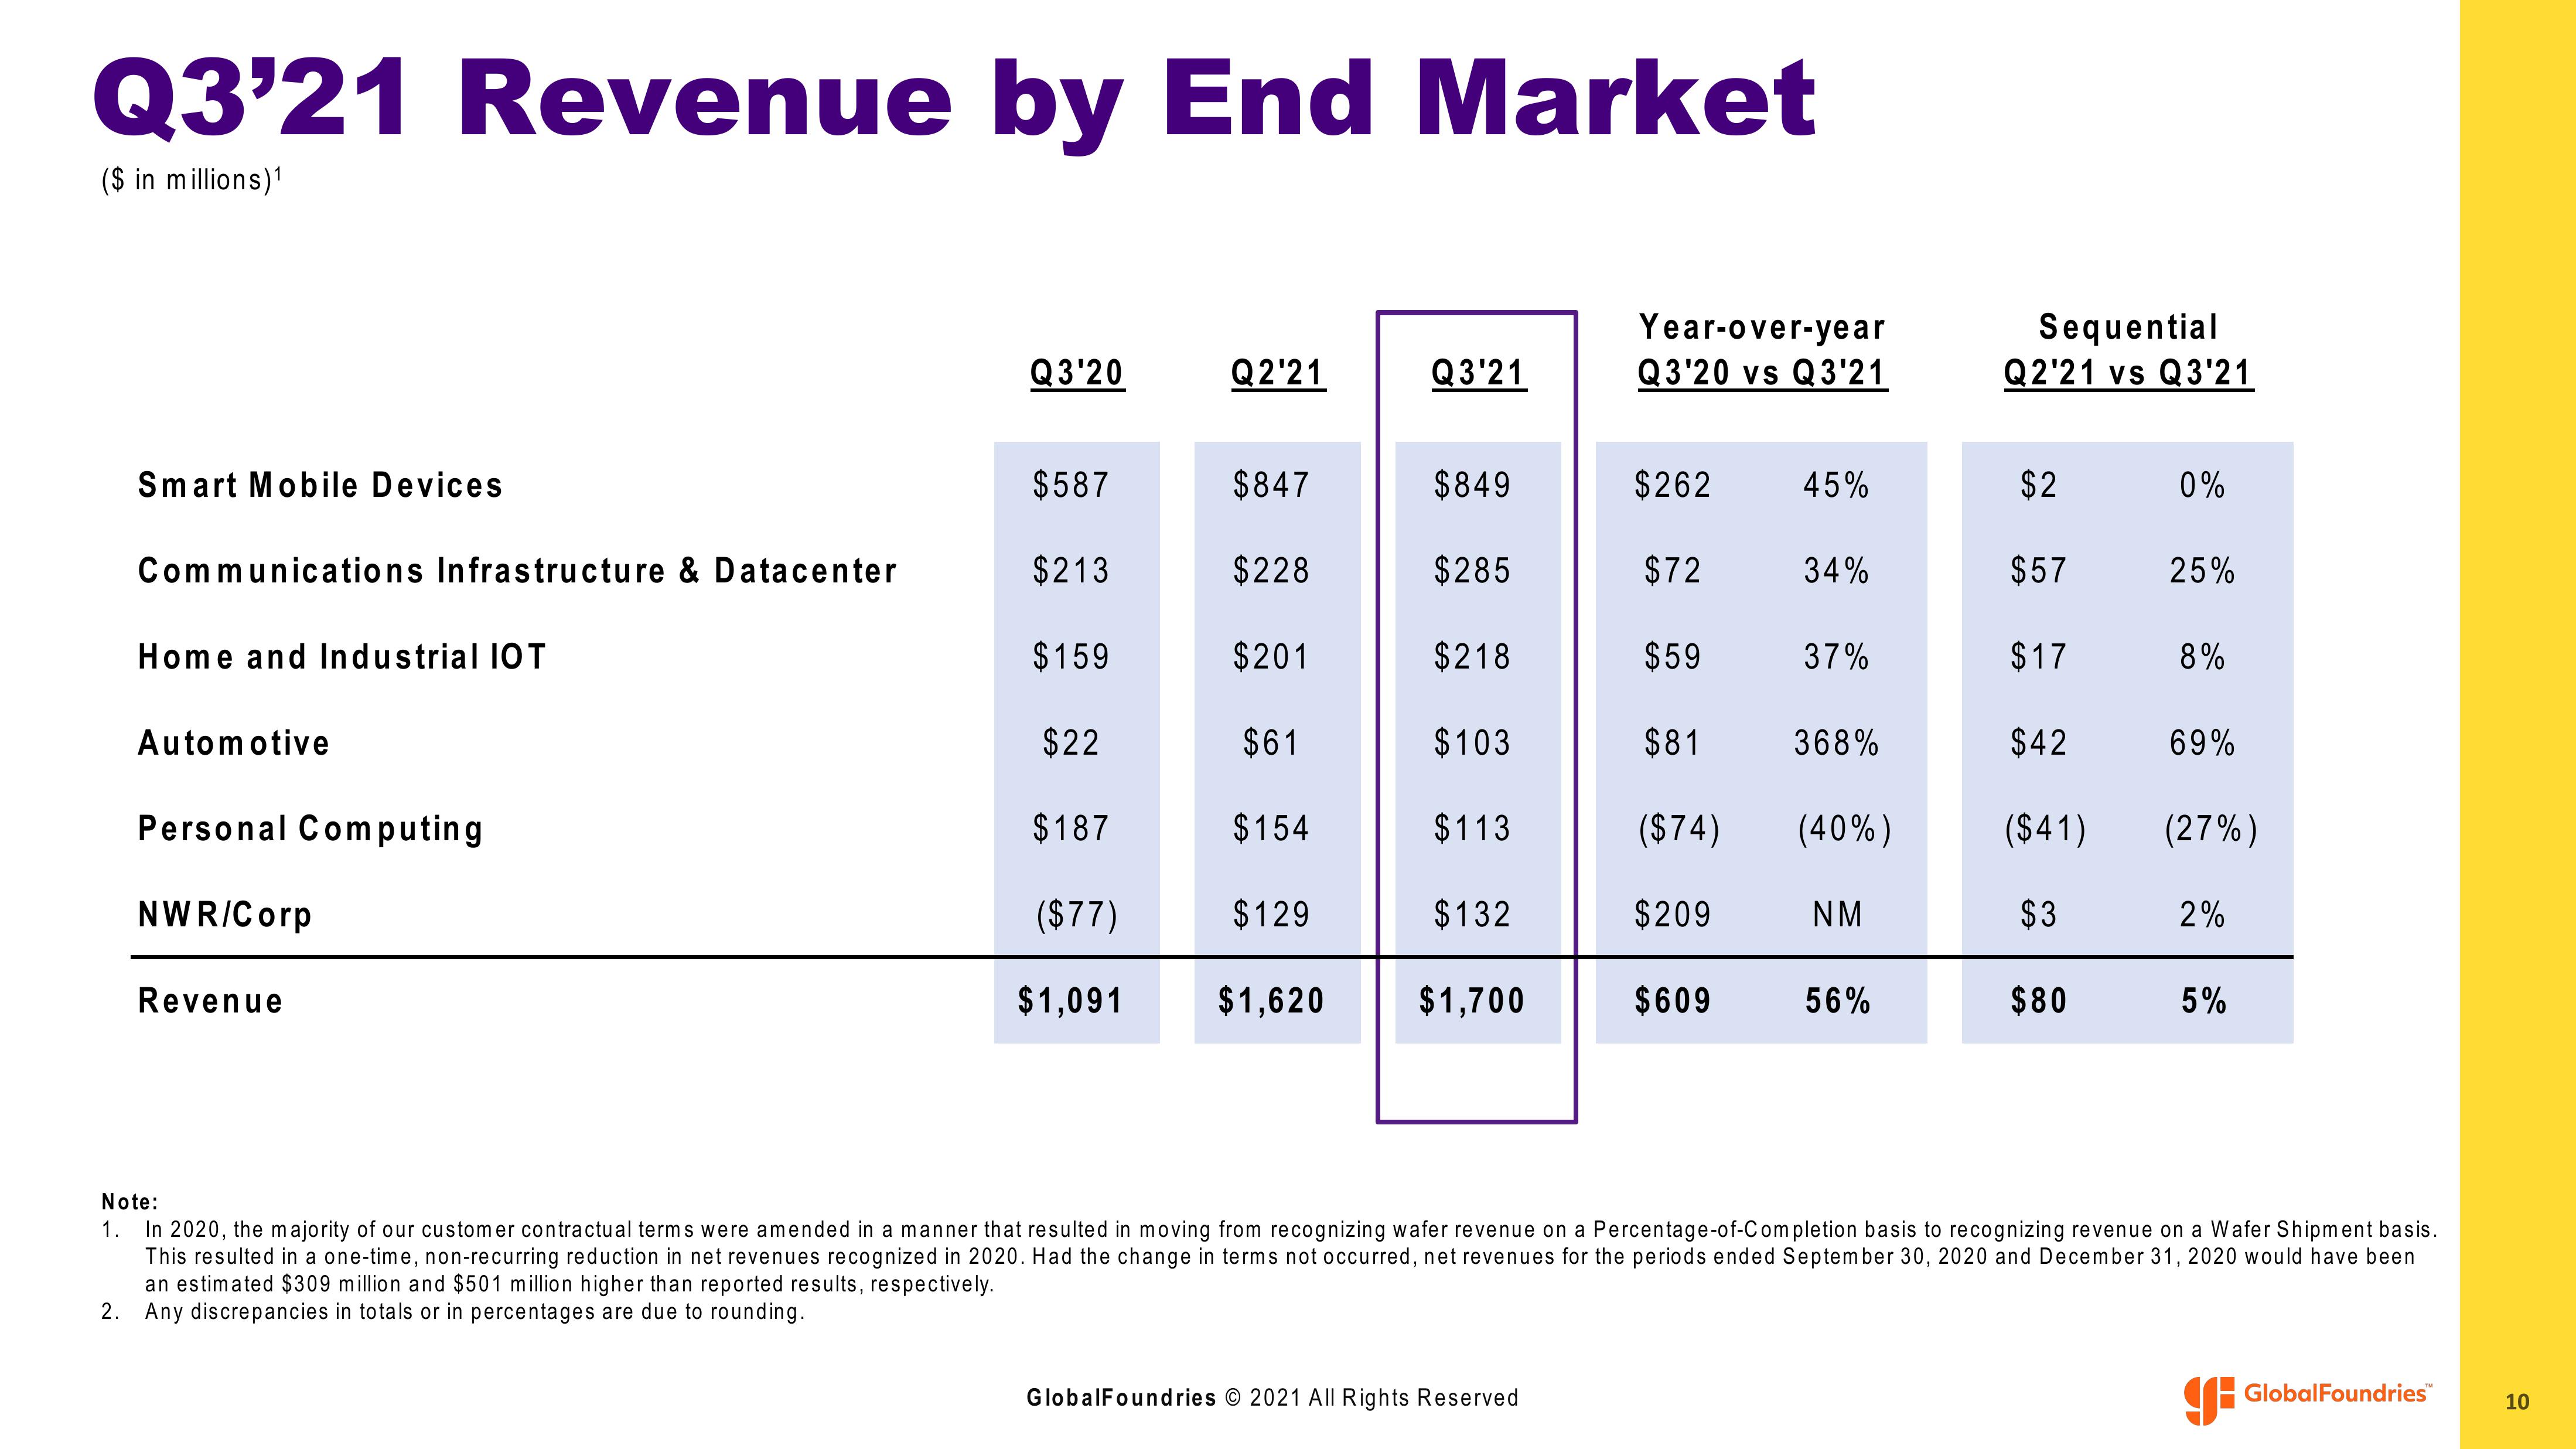
Q3'21 Revenue by End Market
($ in millions) ¹
Smart Mobile Devices
Communications Infrastructure & Datacenter
Home and Industrial IOT
Automotive
Personal Computing
NWR/Corp
Revenue
Q3'20
$587
$213
$159
$22
$187
($77)
$1,091
Q2'21
$847
$228
$201
$61
$154
$129
$1,620
Q3'21
$849
$285
$218
$103
$113
$132
$1,700
Year-over-year
Q3'20 vs Q3'21
GlobalFoundries © 2021 All Rights Reserved
$262 45%
$72
$59
$81
($74)
$209
$609
34%
37%
368%
(40%)
NM
56%
Sequential
Q2'21 vs Q3'21
$2
$57
$17
$42
($41)
$3
$80
0%
25%
8%
69%
(27%)
2%
5%
Note:
1. In 2020, the majority of our customer contractual terms were amended in a manner that resulted in moving from recognizing wafer revenue on a Percentage-of-Completion basis to recognizing revenue on a Wafer Shipment basis.
This resulted in a one-time, non-recurring reduction in net revenues recognized in 2020. Had the change in terms not occurred, net revenues for the periods ended September 30, 2020 and December 31, 2020 would have been
an estimated $309 million and $501 million higher than reported results, respectively.
2. Any discrepancies in totals or in percentages are due to rounding.
GlobalFoundries™
10View entire presentation