BlackRock Investor Conference Presentation Deck
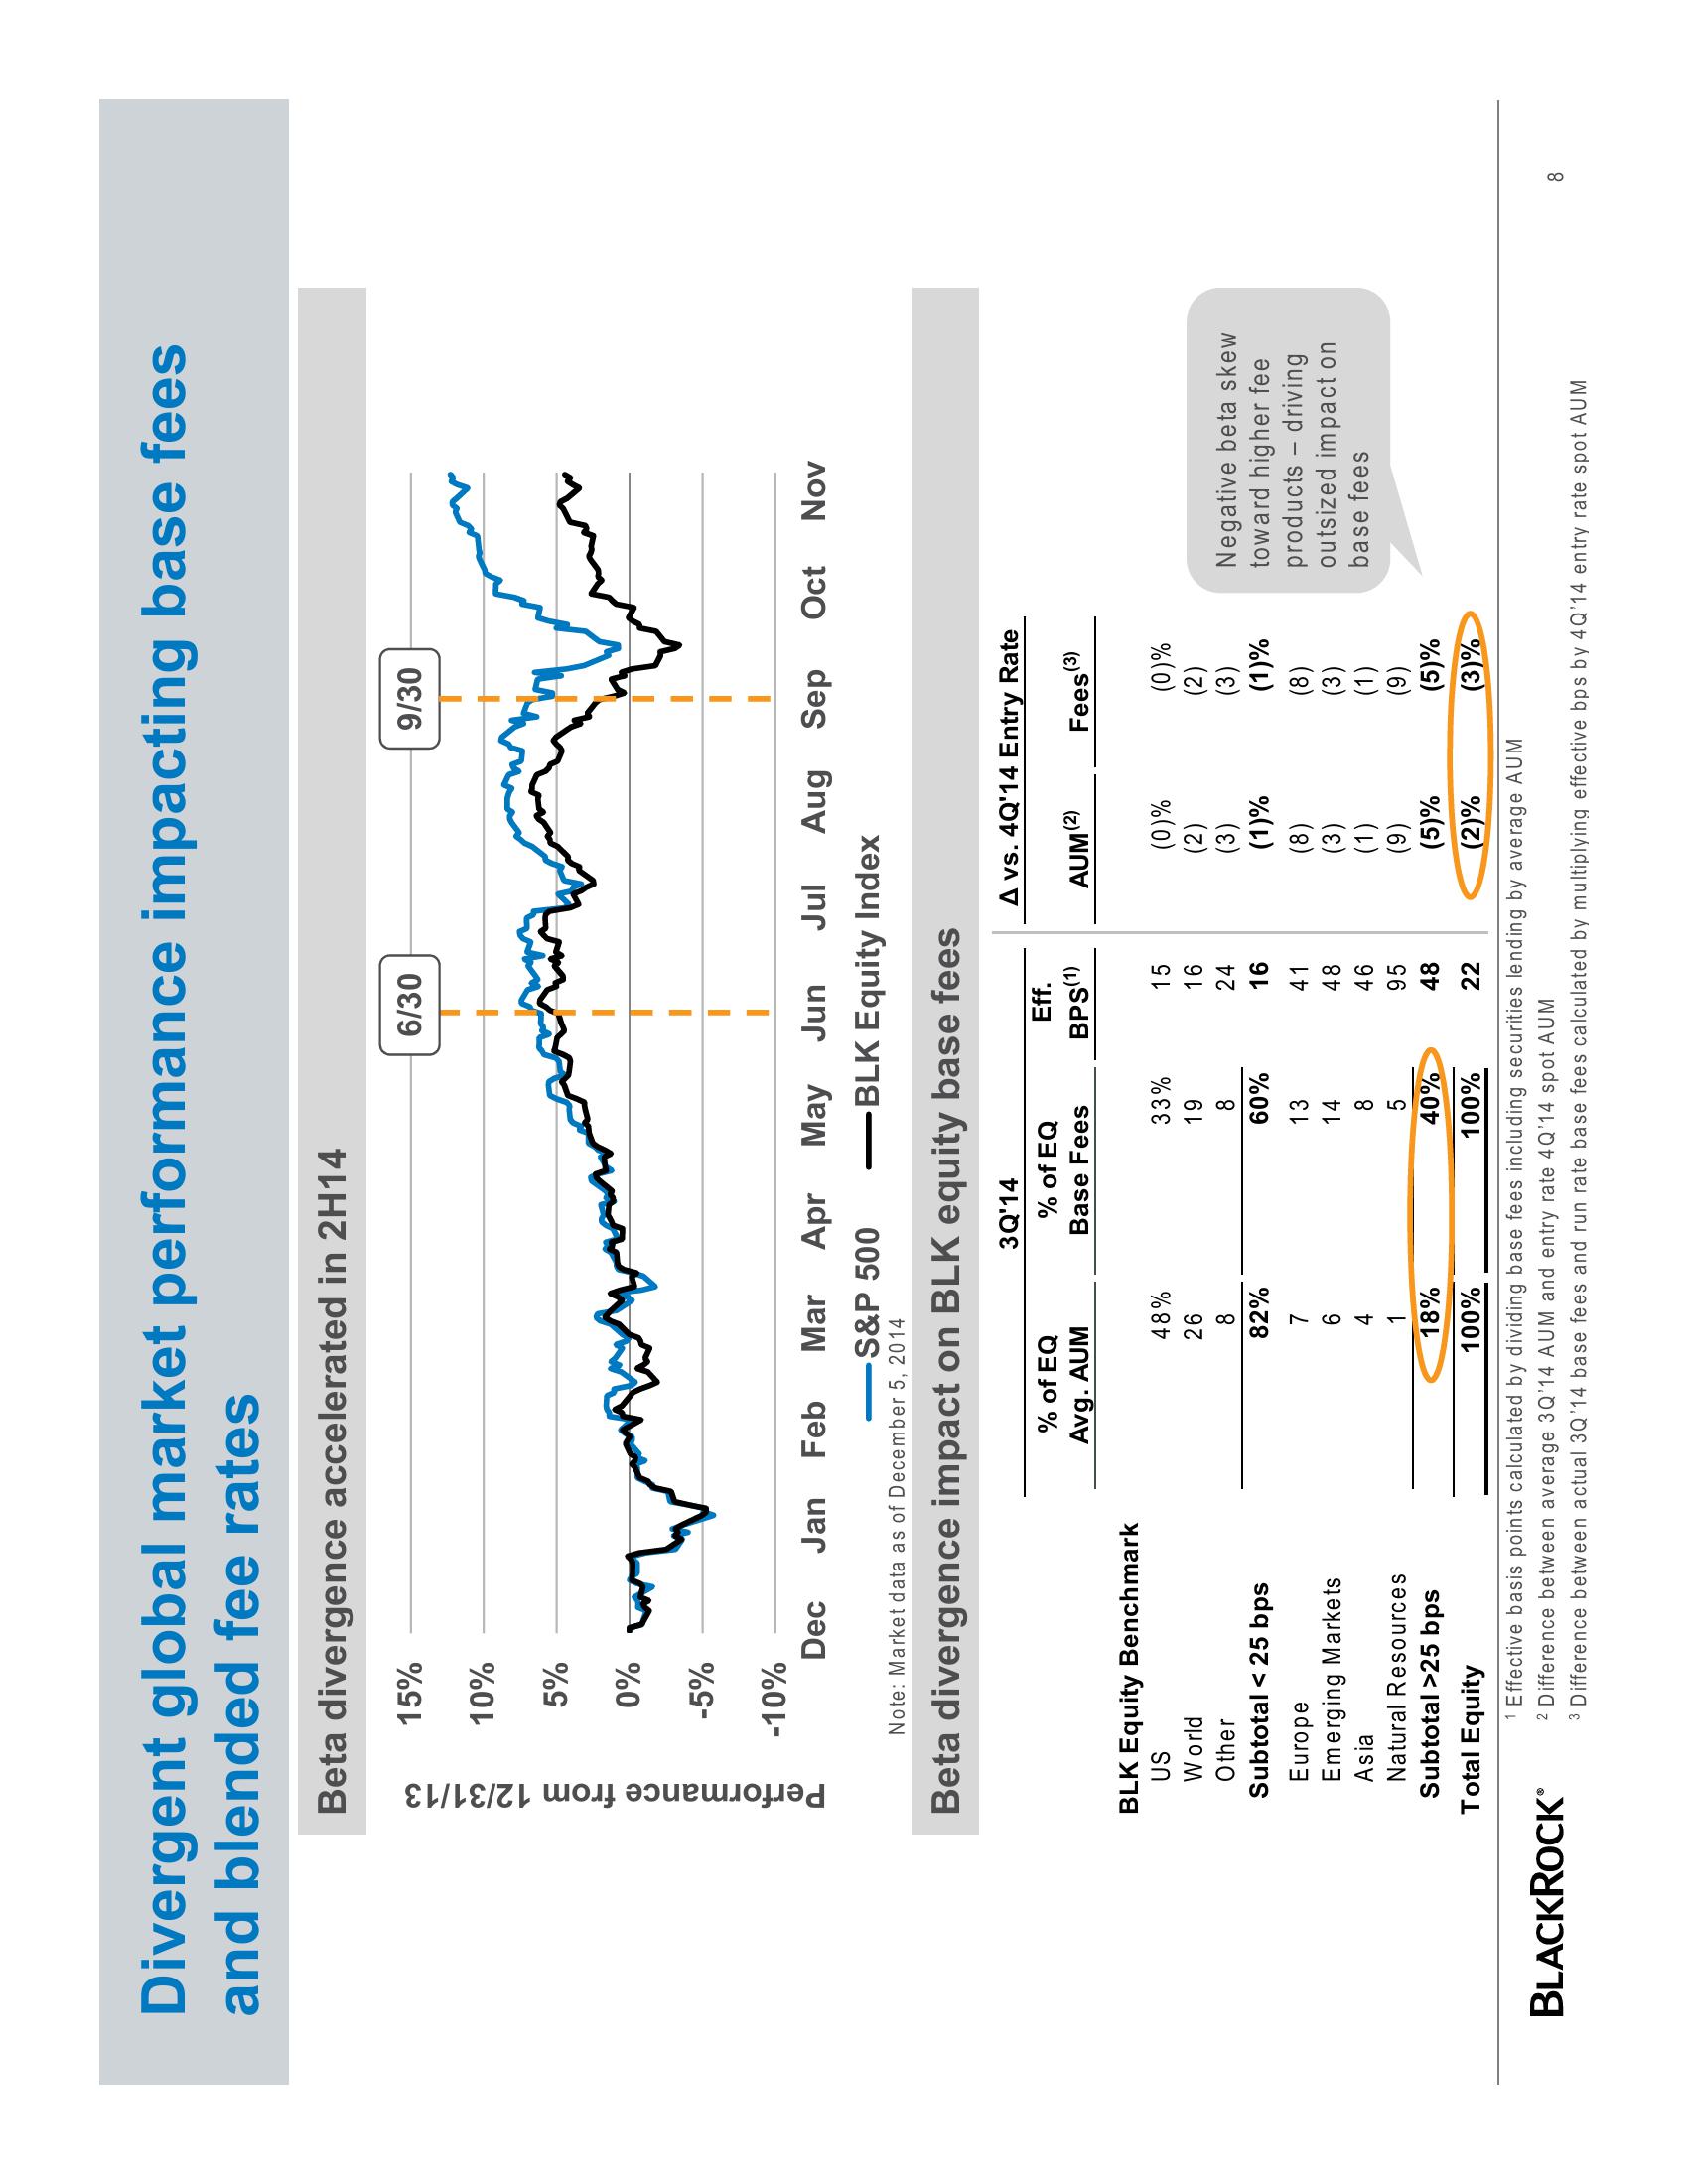
Divergent global market performance impacting base fees
and blended fee rates
Beta divergence accelerated in 2H14
Performance from 12/31/13
15%
10%
5%
0%
BLACKROCK®
-5%
-10%
BLK Equity Benchmark
US
World
Other
Subtotal < 25 bps
Dec Jan Feb
Mar Apr May Jun Jul Aug Sep Oct Nov
-BLK Equity dex
-S&P
Note: Market data as of December 5, 2014
Beta divergence impact on BLK equity base fees
Europe
Emerging Markets
Asia
Natural Resources
Subtotal >25 bps
MA
wman
% of EQ
Avg. AUM
48%
26
8
82%
7
6
4
1
18%
100%
3Q'14
% of EQ
Base Fees
33%
19
8
60%
13
14
6/30
8
5
40%
100%
Eff.
BPS(1)
15
16
24
16
41
48
46
95
48
22
A vs. 4Q'14 Entry Rate
AUM
(2)
9/30
(0)%
(2)
(3)
(1)%
(8)
(3)
(1)
(9)
(5)%
(2)%
(3)
Fees
(0)%
(2)
(3)
(1)%
(8)
(3)
(1)
(9)
(5)%
(3)%
Negative beta skew
toward higher fee
products - driving
outsized impact on
base fees
Total Equity
1 Effective basis points calculated by dividing base fees including securities lending by average AUM
2 Difference between average 3Q'14 AUM and entry rate 4Q'14 spot AUM
3 Difference between actual 3Q'14 base fees and run rate base fees calculated by multiplying effective bps by 4Q'14 entry rate spot AUM
8View entire presentation