Tesla Results Presentation Deck
23
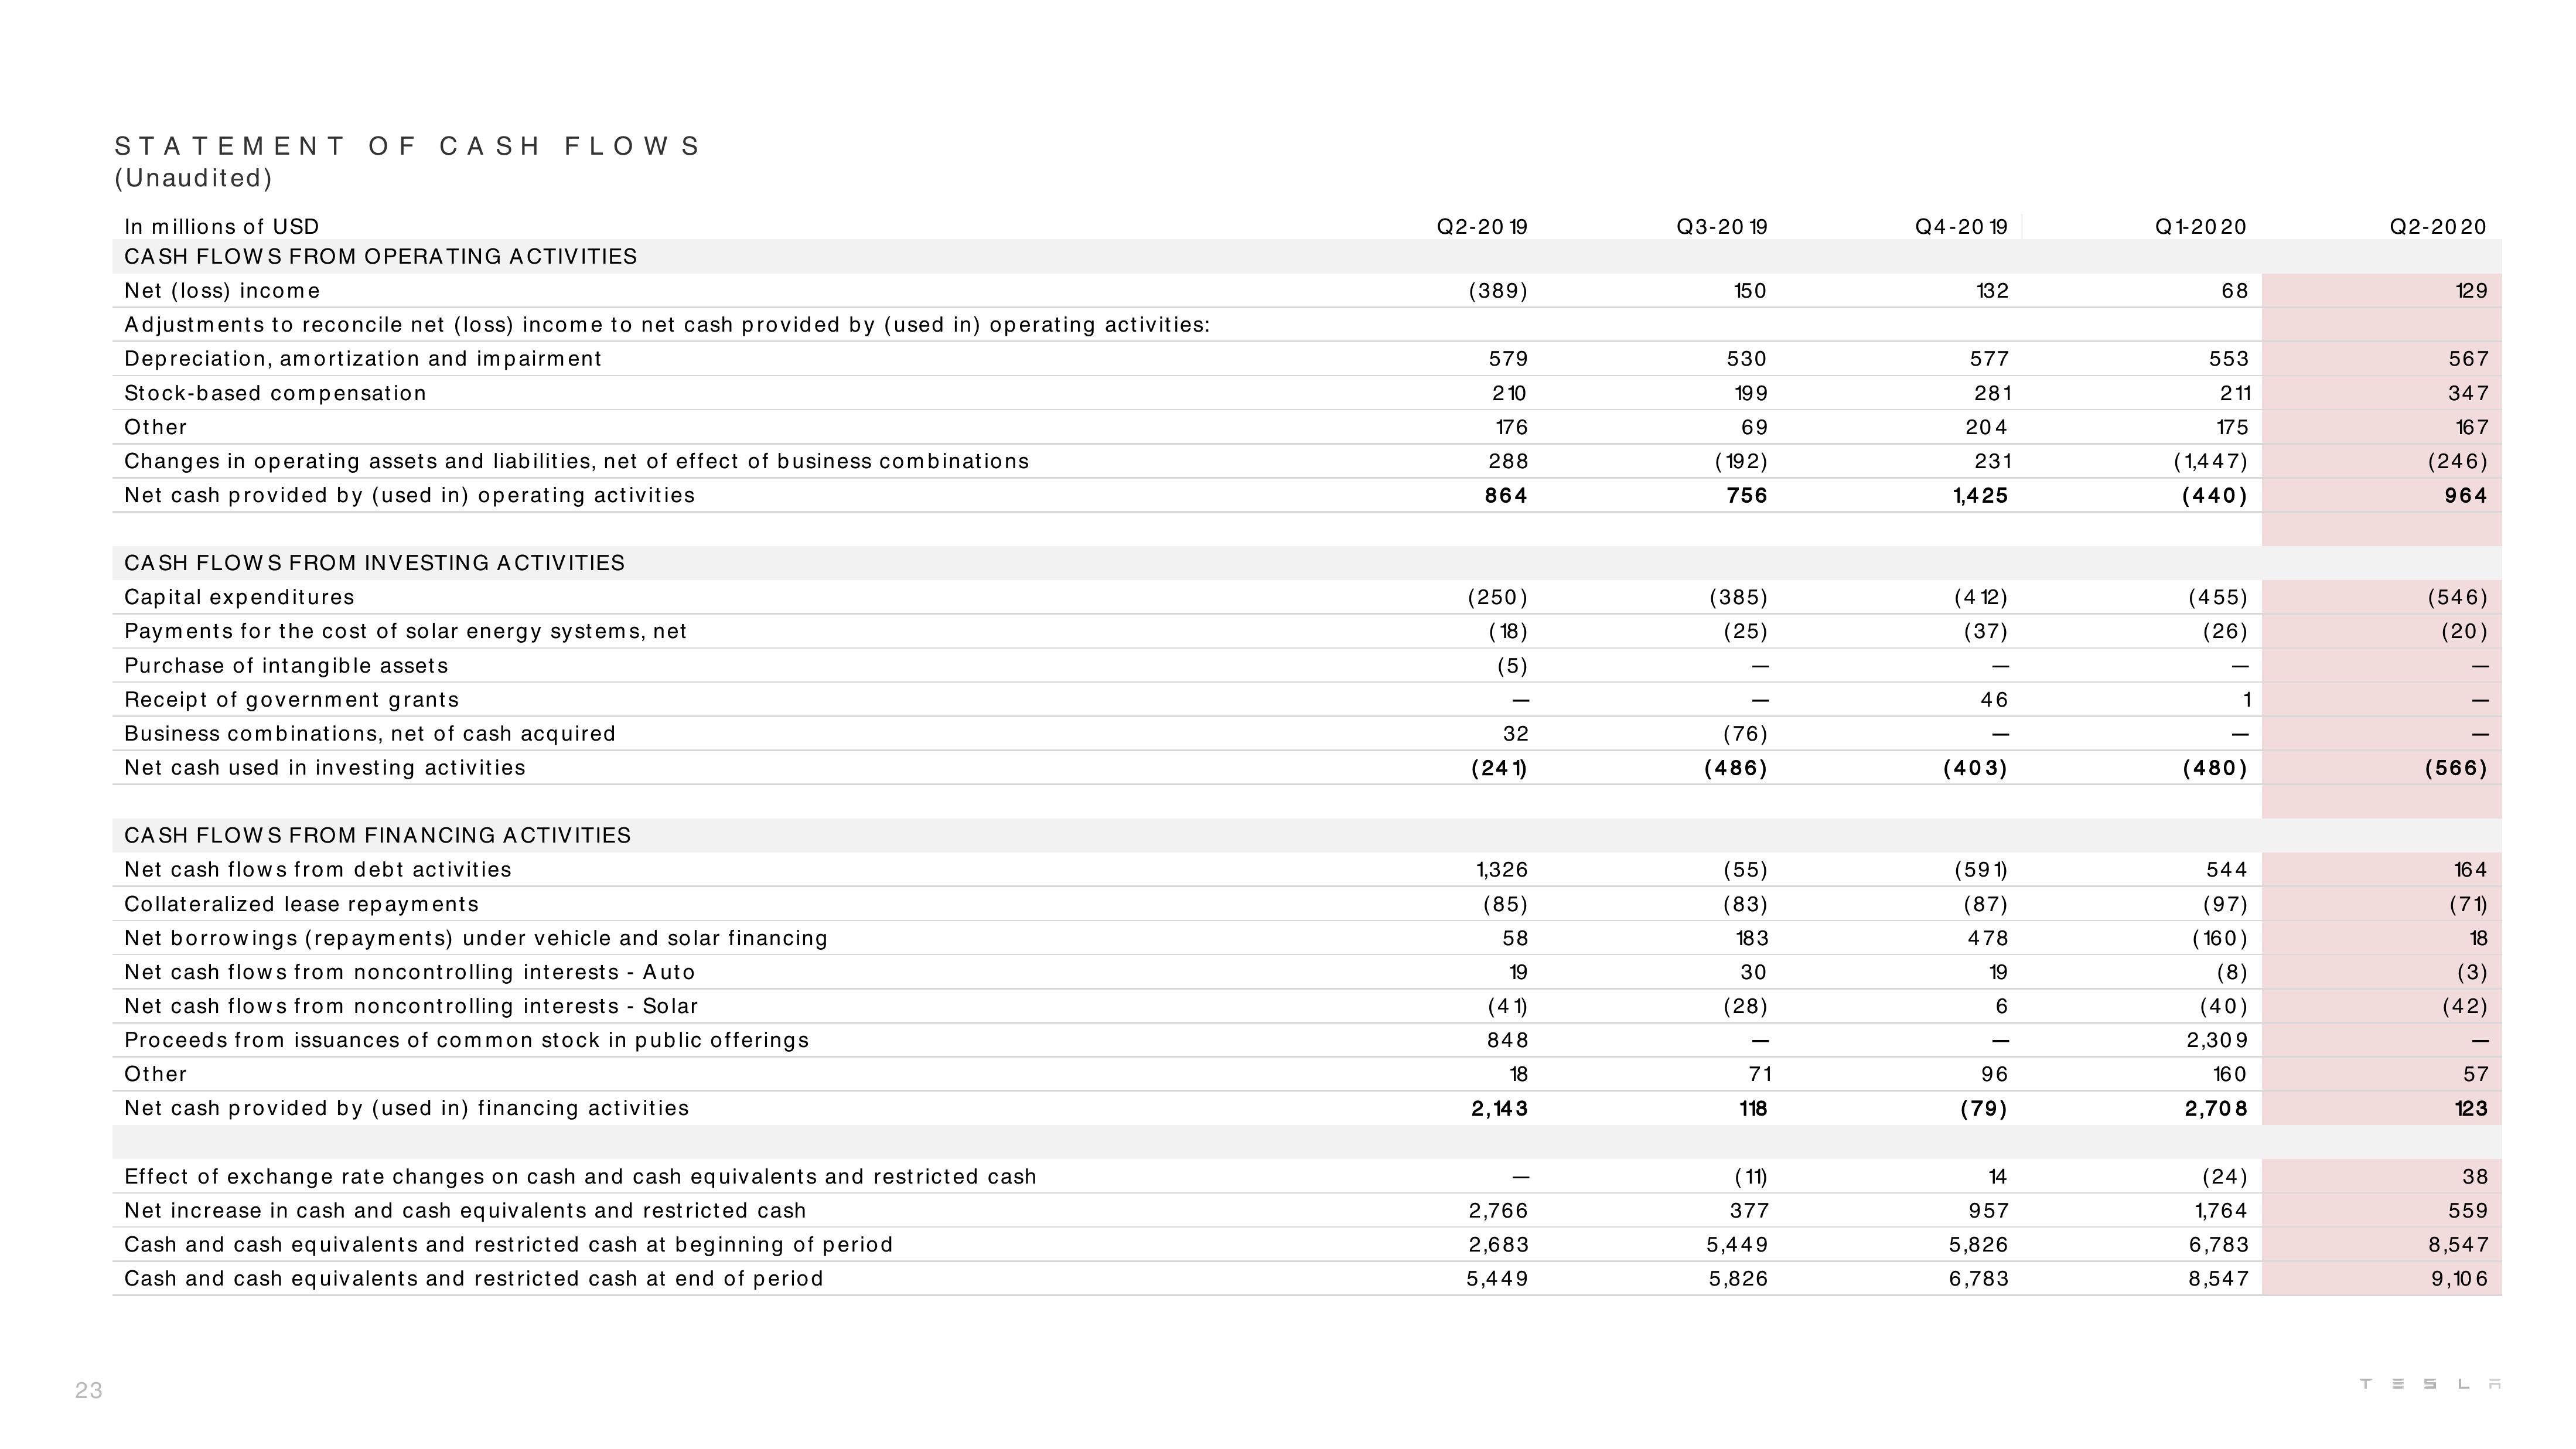
STATEMENT OF CASH FLOWS
(Unaudited)
In millions of USD
CASH FLOWS FROM OPERATING ACTIVITIES
Net (loss) income
Adjustments to reconcile net (loss) income to net cash provided by (used in) operating activities:
Depreciation, amortization and impairment
Stock-based compensation
Other
Changes in operating assets and liabilities, net of effect of business combinations
Net cash provided by (used in) operating activities
CASH FLOWS FROM INVESTING ACTIVITIES
Capital expenditures
Payments for the cost of solar energy systems, net
Purchase of intangible assets
Receipt of government grants
Business combinations, net of cash acquired
Net cash used in investing activities
CASH FLOWS FROM FINANCING ACTIVITIES
Net cash flows from debt activities
Collateralized lease repayments
Net borrowings (repayments) under vehicle and solar financing
Net cash flows from noncontrolling interests - Auto
Net cash flows from noncontrolling interests - Solar
Proceeds from issuances of common stock in public offerings
Other
Net cash provided by (used in) financing activities
Effect of exchange rate changes on cash and cash equivalents and restricted cash
Net increase in cash and cash equivalents and restricted cash
Cash and cash equivalents and restricted cash at beginning of period
Cash and cash equivalents and restricted cash at end of period
Q2-20 19
(389)
579
210
176
288
864
(250)
(18)
(5)
32
(241)
1,326
(85)
58
19
(41)
848
18
2,143
2,766
2,683
5,449
Q3-20 19
150
530
199
69
(192)
756
(385)
(25)
(76)
(486)
(55)
(83)
183
30
(28)
71
118
(11)
377
5,449
5,826
Q4-20 19
132
577
281
204
231
1,425
(412)
(37)
46
(403)
(591)
(87)
478
19
6
-
96
(79)
14
957
5,826
6,783
Q1-20 20
68
553
211
175
(1,447)
(440)
(455)
(26)
1
(480)
544
(97)
(160)
(8)
(40)
2,309
160
2,708
(24)
1,764
6,783
8,547
Q2-2020
129
567
347
16 7
(246)
964
(546)
(20)
(566)
164
(71)
18
(3)
(42)
57
123
38
559
8,547
9,10 6
TESLAView entire presentation