Allwyn SPAC Presentation Deck
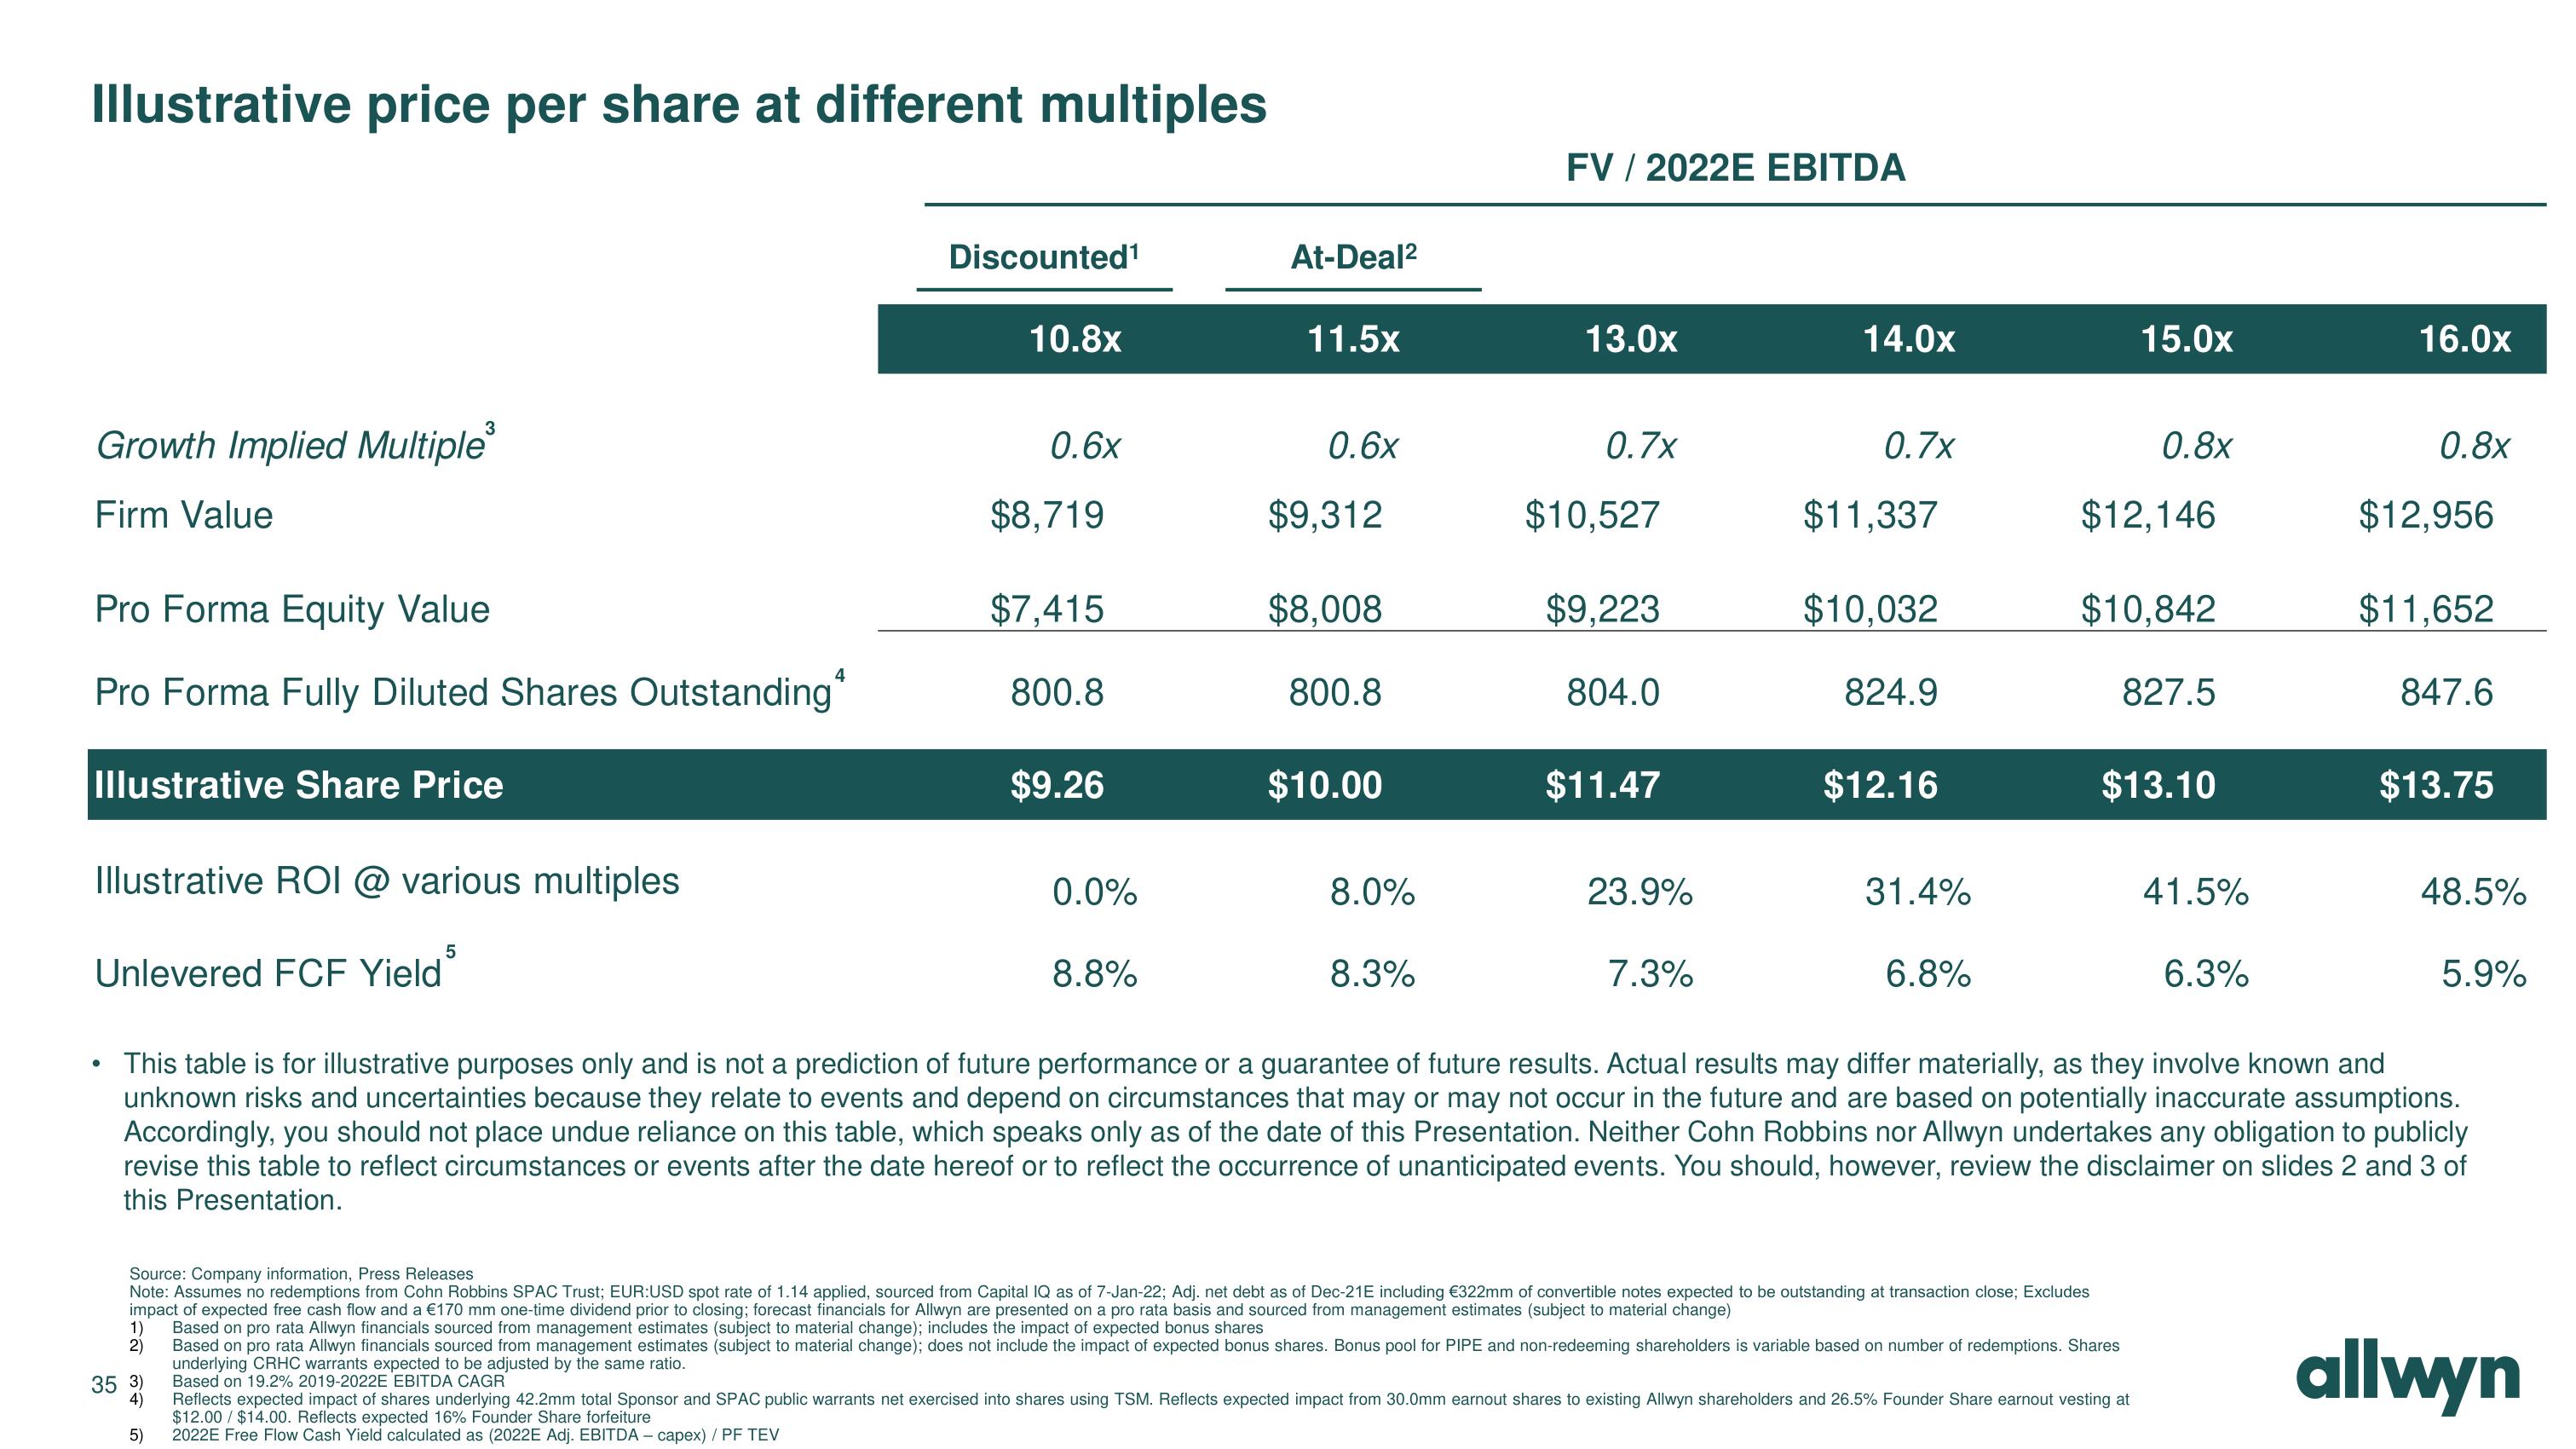
Illustrative price per share at different multiples
Growth Implied Multiple³
Firm Value
Pro Forma Equity Value
Pro Forma Fully Diluted Shares Outstanding*
Illustrative Share Price
Illustrative ROI @ various multiples
Unlevered FCF Yield
5
1)
2)
Discounted¹
35 3)
4)
5)
10.8x
0.6x
$8,719
$7,415
800.8
$9.26
0.0%
8.8%
At-Deal²
11.5x
0.6x
$9,312
$8,008
800.8
$10.00
8.0%
8.3%
FV / 2022E EBITDA
13.0x
0.7x
$10,527
$9,223
804.0
$11.47
23.9%
7.3%
14.0x
0.7x
$11,337
$10,032
824.9
$12.16
31.4%
6.8%
15.0x
0.8x
$12,146
Source: Company information, Press Releases
Note: Assumes no redemptions from Cohn Robbins SPAC Trust; EUR:USD spot rate of 1.14 applied, sourced from Capital IQ as of 7-Jan-22; Adj. net debt as of Dec-21E including €322mm of convertible notes expected to be outstanding at transaction close; Excludes
impact of expected free cash flow and a €170 mm one-time dividend prior to closing; forecast financials for Allwyn are presented on a pro rata basis and sourced from management estimates (subject to material change)
Based on pro rata Allwyn financials sourced from management estimates (subject to material change); includes the impact of expected bonus shares
Based on pro rata Allwyn financials sourced from management estimates (subject to material change); does not include the impact of expected bonus shares. Bonus pool for PIPE and non-redeeming shareholders is variable based on number of redemptions. Shares
underlying CRHC warrants expected to be adjusted by the same ratio.
Based on 19.2% 2019-2022E EBITDA CAGR
Reflects expected impact of shares underlying 42.2mm total Sponsor and SPAC public warrants net exercised into shares using TSM. Reflects expected impact from 30.0mm earnout shares to existing Allwyn shareholders and 26.5% Founder Share earnout vesting at
$12.00 / $14.00. Reflects expected 16% Founder Share forfeiture
2022E Free Flow Cash Yield calculated as (2022E Adj. EBITDA - capex) / PF TEV
$10,842
827.5
$13.10
41.5%
6.3%
16.0x
0.8x
$12,956
$11,652
847.6
$13.75
This table is for illustrative purposes only and is not a prediction of future performance or a guarantee of future results. Actual results may differ materially, as they involve known and
unknown risks and uncertainties because they relate to events and depend on circumstances that may or may not occur in the future and are based on potentially inaccurate assumptions.
Accordingly, you should not place undue reliance on this table, which speaks only as of the date of this Presentation. Neither Cohn Robbins nor Allwyn undertakes any obligation to publicly
revise this table to reflect circumstances or events after the date hereof or to reflect the occurrence of unanticipated events. You should, however, review the disclaimer on slides 2 and 3 of
this Presentation.
48.5%
5.9%
allwynView entire presentation