Despegar Results Presentation Deck
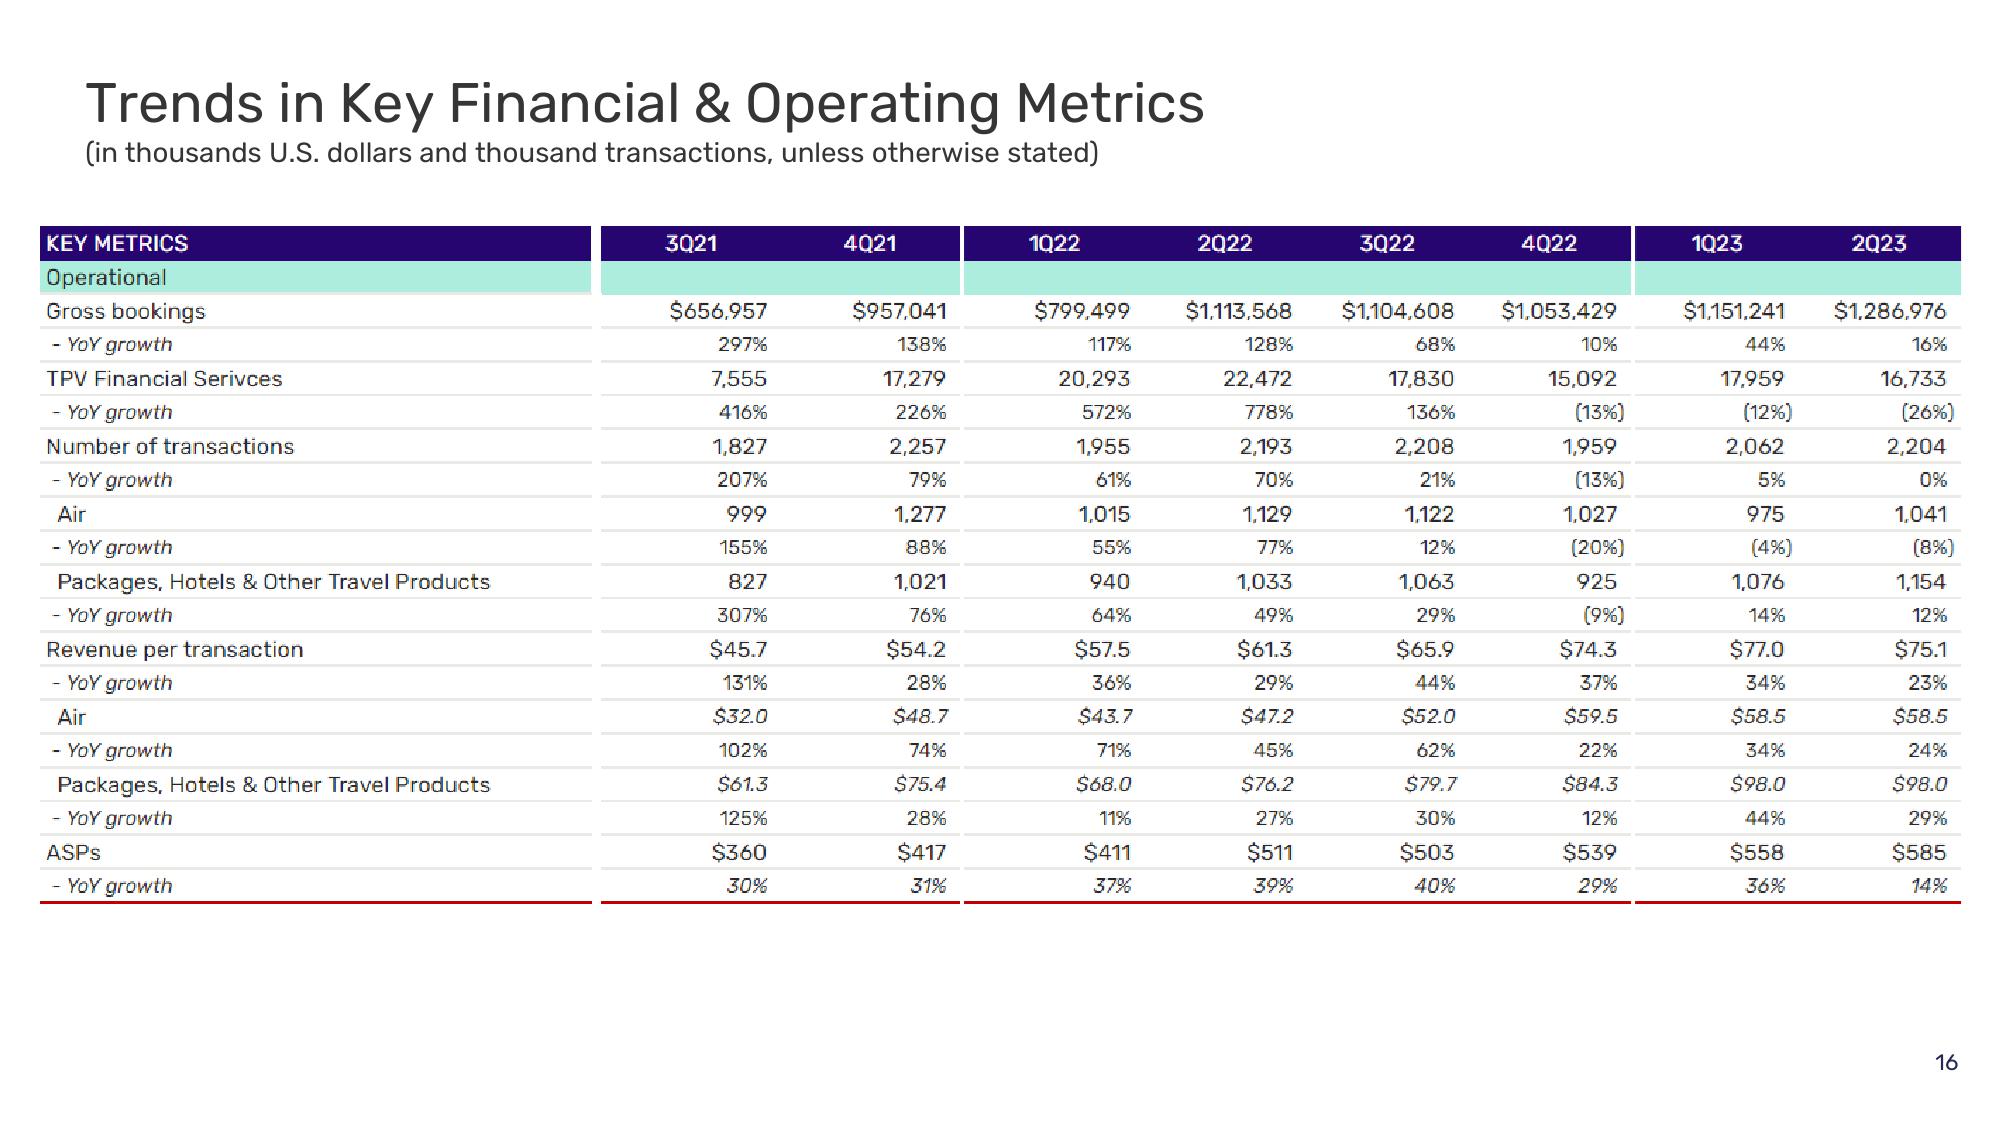
Trends in Key Financial & Operating Metrics
(in thousands U.S. dollars and thousand transactions, unless otherwise stated)
KEY METRICS
Operational
Gross bookings
- YoY growth
TPV Financial Serivces
- YoY growth
Number of transactions
- YoY growth
Air
- YoY growth
Packages, Hotels & Other Travel Products
- YoY growth
Revenue per transaction
- YoY growth
Air
- YoY growth
Packages, Hotels & Other Travel Products
- YoY growth
ASPS
- YoY growth
3021
$656,957
297%
7,555
416%
1,827
207%
999
155%
827
307%
$45.7
131%
$32.0
102%
$61.3
125%
$360
30%
4021
$957,041
138%
17,279
226%
2,257
79%
1,277
88%
1,021
76%
$54.2
28%
$48.7
74%
$75.4
28%
$417
31%
1022
$799.499
117%
20,293
572%
1,955
61%
1,015
55%
940
64%
$57.5
36%
$43.7
71%
$68.0
11%
$411
37%
2022
$1,113,568
128%
22,472
778%
2,193
70%
1,129
77%
1,033
49%
$61.3
29%
$47.2
45%
$76.2
27%
$511
39%
3022
$1,104,608
68%
17,830
136%
2,208
21%
1,122
12%
1,063
29%
$65.9
44%
$52.0
62%
$79.7
30%
$503
40%
4022
$1,053,429
10%
15,092
(13%)
1,959
(13%)
1,027
(20%)
925
(9%)
$74.3
37%
$59.5
22%
$84.3
12%
$539
29%
1023
2023
$1,151,241 $1,286,976
44%
17,959
(12%)
2,062
5%
975
(4%)
1,076
14%
$77.0
34%
$58.5
34%
$98.0
44%
$558
36%
16%
16,733
(26%)
2,204
0%
1,041
(8%)
1,154
12%
$75.1
23%
$58.5
24%
$98.0
29%
$585
14%
16View entire presentation