Grab SPAC Presentation Deck
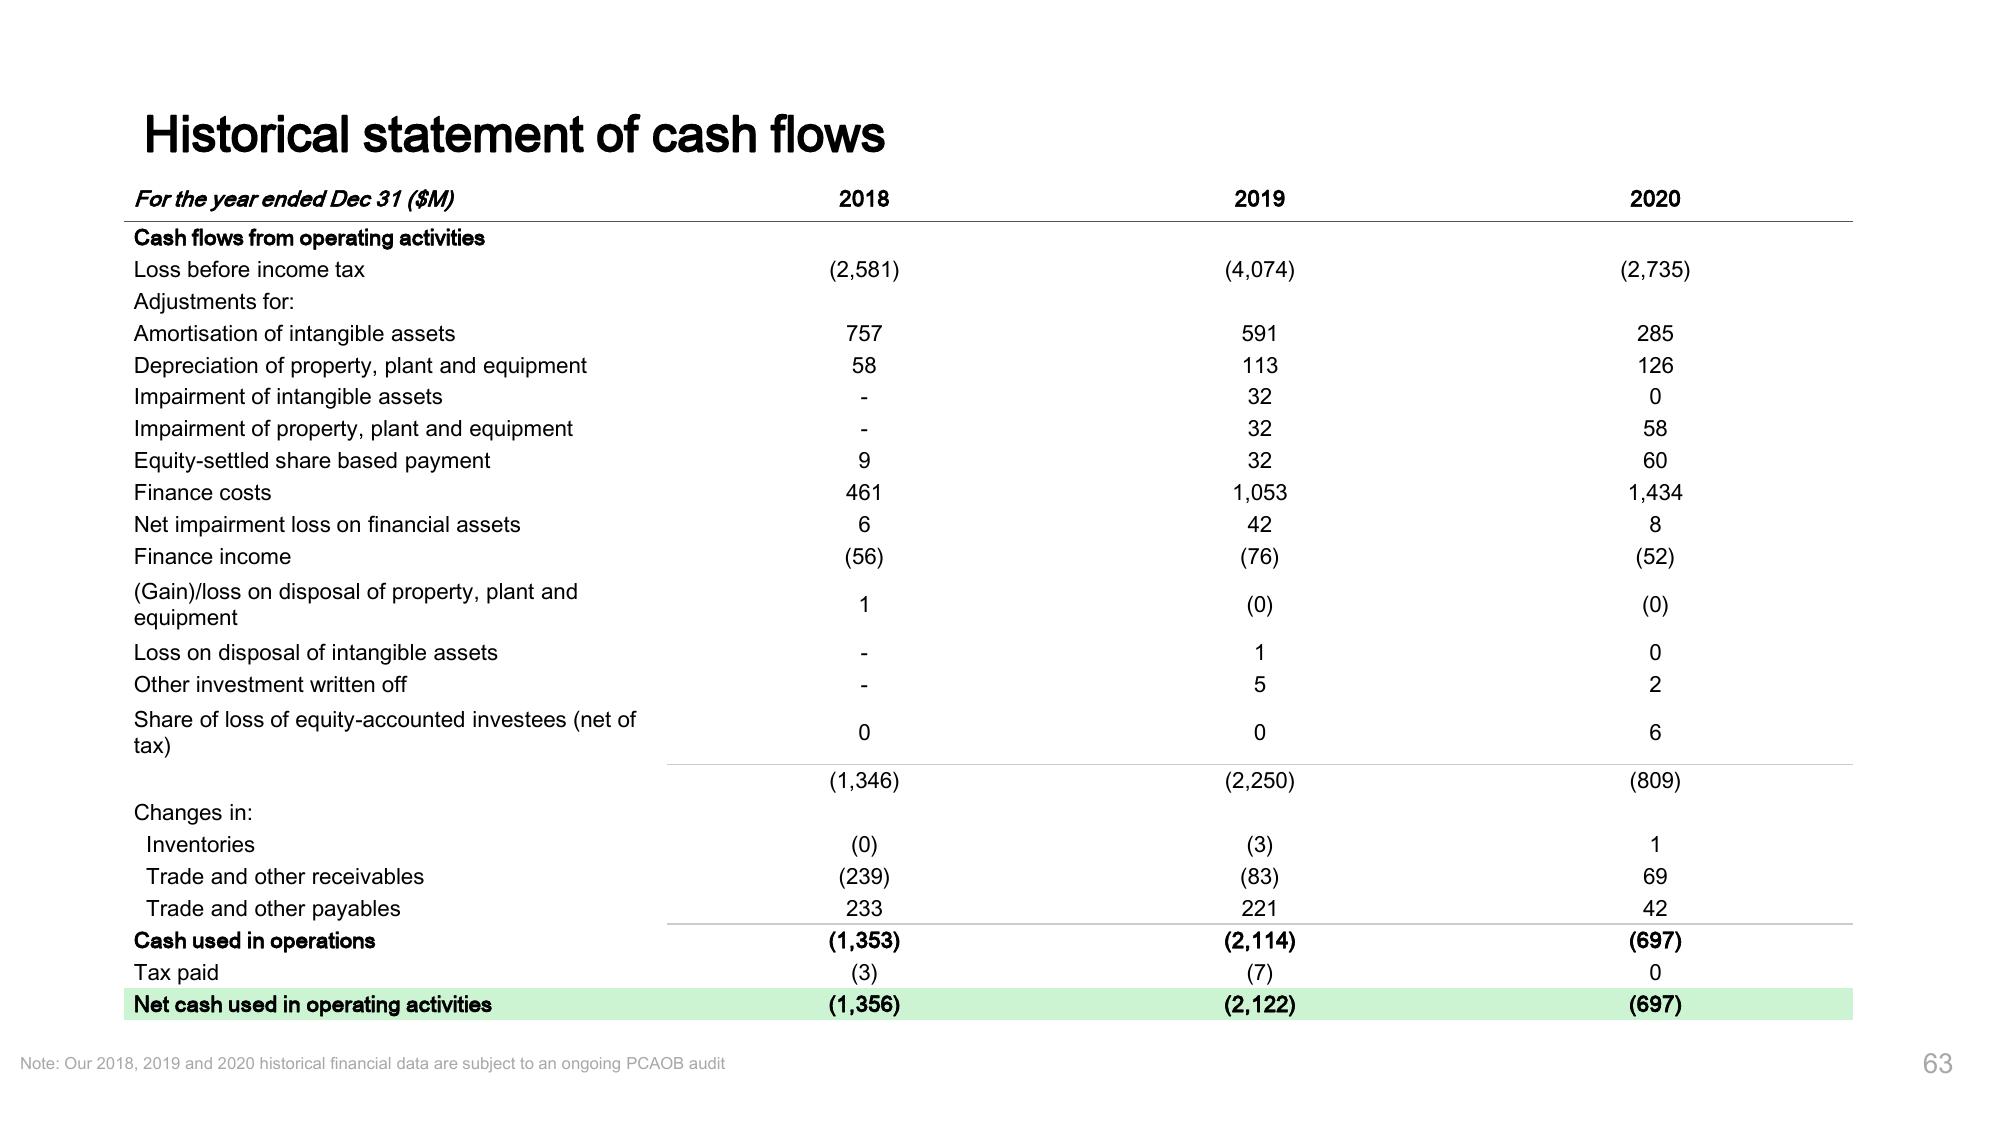
Historical statement of cash flows
For the year ended Dec 31 ($M)
Cash flows from operating activities
Loss before income tax
Adjustments for:
Amortisation of intangible assets
Depreciation of property, plant and equipment
Impairment of intangible assets
Impairment of property, plant and equipment
Equity-settled share based payment
Finance costs
Net impairment loss on financial assets
Finance income
(Gain)/loss on disposal of property, plant and
equipment
Loss on disposal of intangible assets
Other investment written off
Share of loss of equity-accounted investees (net of
tax)
Changes in:
Inventories
Trade and other receivables
Trade and other payables
Cash used in operations
Tax paid
Net cash used in operating activities
Note: Our 2018, 2019 and 2020 historical financial data are subject to an ongoing PCAOB audit
2018
(2,581)
757
58
9
461
6
(56)
1
0
(1,346)
(0)
(239)
233
(1,353)
(3)
(1,356)
2019
(4,074)
591
113
32
32
32
1,053
42
(76)
(0)
15
0
(2,250)
(3)
(83)
221
(2,114)
(7)
(2,122)
2020
(2,735)
285
126
0
58
60
1,434
8
(52)
(0)
0
2
6
(809)
1
69
42
(697)
0
(697)
63View entire presentation