Yellow Corporation Investor Conference Presentation Deck
Free Cash Flow
($ in millions)
Adjusted EBITDA
Total restructuring professional fees
Cash paid for interest
Cash paid for letter of credit fees
Working capital cash flows excluding income tax, net
Net cash provided by (used in) operating activities before income taxes
Cash received from income taxes, net
Net cash provided by (used in) operating activities
Acquisition of property and equipment
Free cash flow (deficit)
Total restructuring professional fees
Adjusted free cash flow (deficit)
$
2012
77.0
(28.9)
(9.4)
(14.3)
24.4
(2.3)
22.1
(18.3)
3.8
3.8
Three months
2011
41.3
(4.3)
(22.7)
(9.5)
$
27.3
32.1
(5.2)
26.9
Change
$ 35.7
4.3
(6.2)
0.1
(35.5)
(8.6)
4.3
(4.3) $
(41.6)
(7.7)
2.9
(4.8)
17.2
12.4
(4.3)
8.1
Twelve months
2012
241.2 $
(3.0)
(120.5)
(38.0)
(111.5)
(31.8)
5.9
(25.9)
(66.4)
(92.3)
3.0
(89.3)
$
2011
159.2 $
(44.0)
(67.5)
(16.7)
(50.5)
(19.5)
(6.5)
(26.0)
(71.6)
(97.6)
44.0
(53.6) $
Change
82.0
41.0
(53.0)
(21.3)
(61.0)
(12.3)
12.4
0.1
5.2
5.3
(41.0)
(35.7)
YRC Worldwide
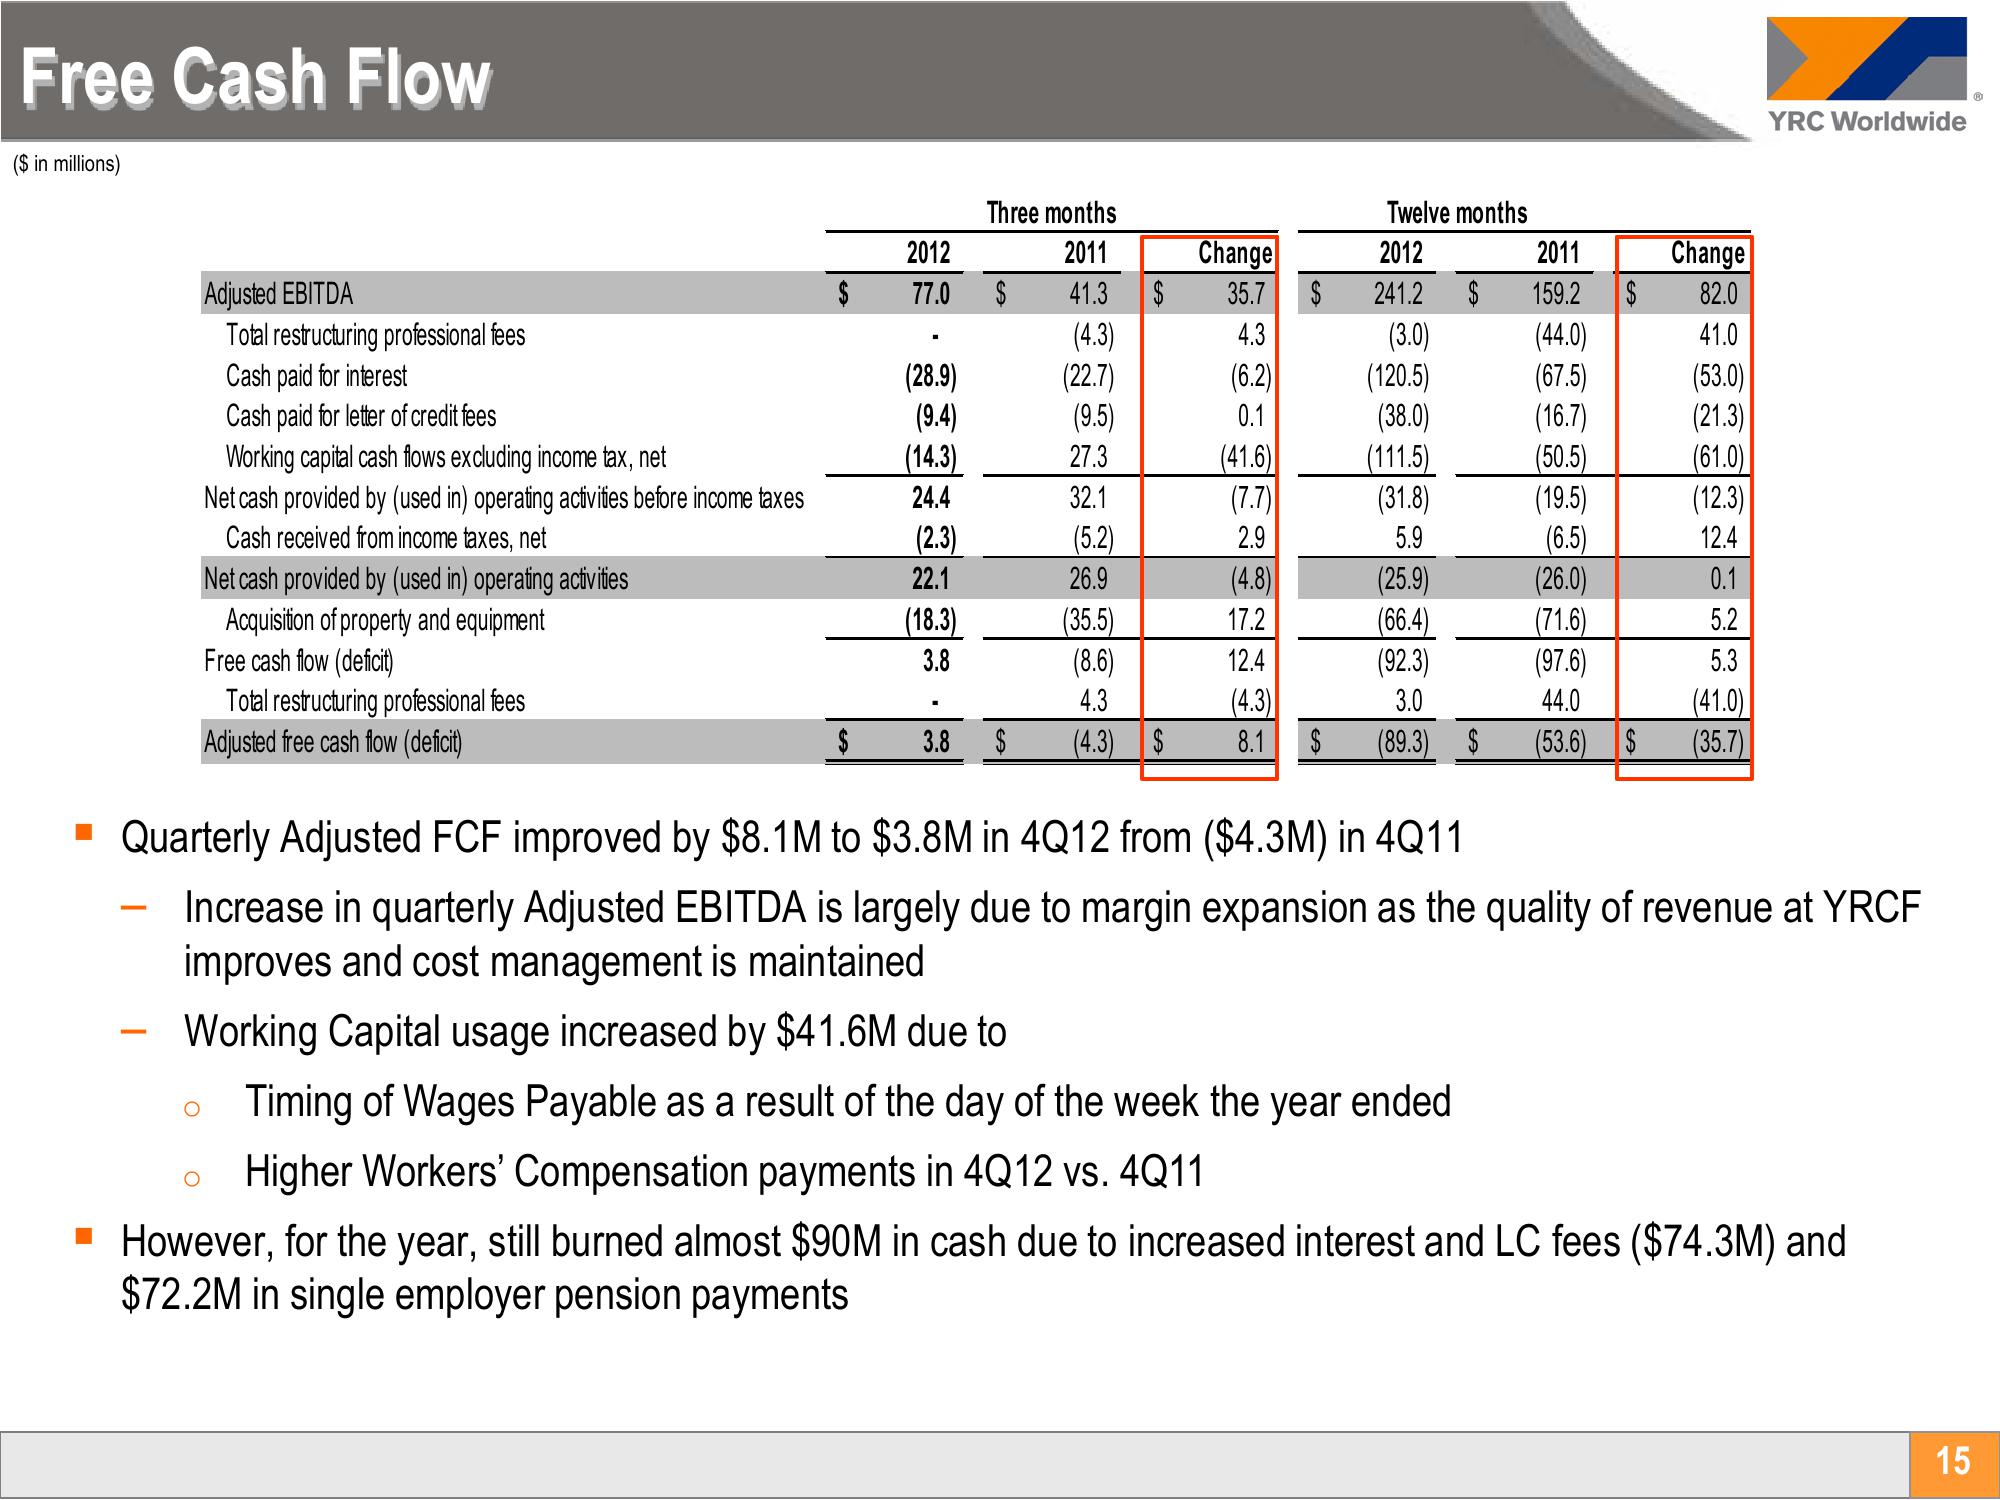
▪ Quarterly Adjusted FCF improved by $8.1M to $3.8M in 4Q12 from ($4.3M) in 4Q11
Increase in quarterly Adjusted EBITDA is largely due to margin expansion as the quality of revenue at YRCF
improves and cost management is maintained
Working Capital usage increased by $41.6M due to
o Timing of Wages Payable as a result of the day of the week the year ended
Higher Workers' Compensation payments in 4Q12 vs. 4Q11
▪ However, for the year, still burned almost $90M in cash due to increased interest and LC fees ($74.3M) and
$72.2M in single employer pension payments
15View entire presentation