LegalZoom.com Results Presentation Deck
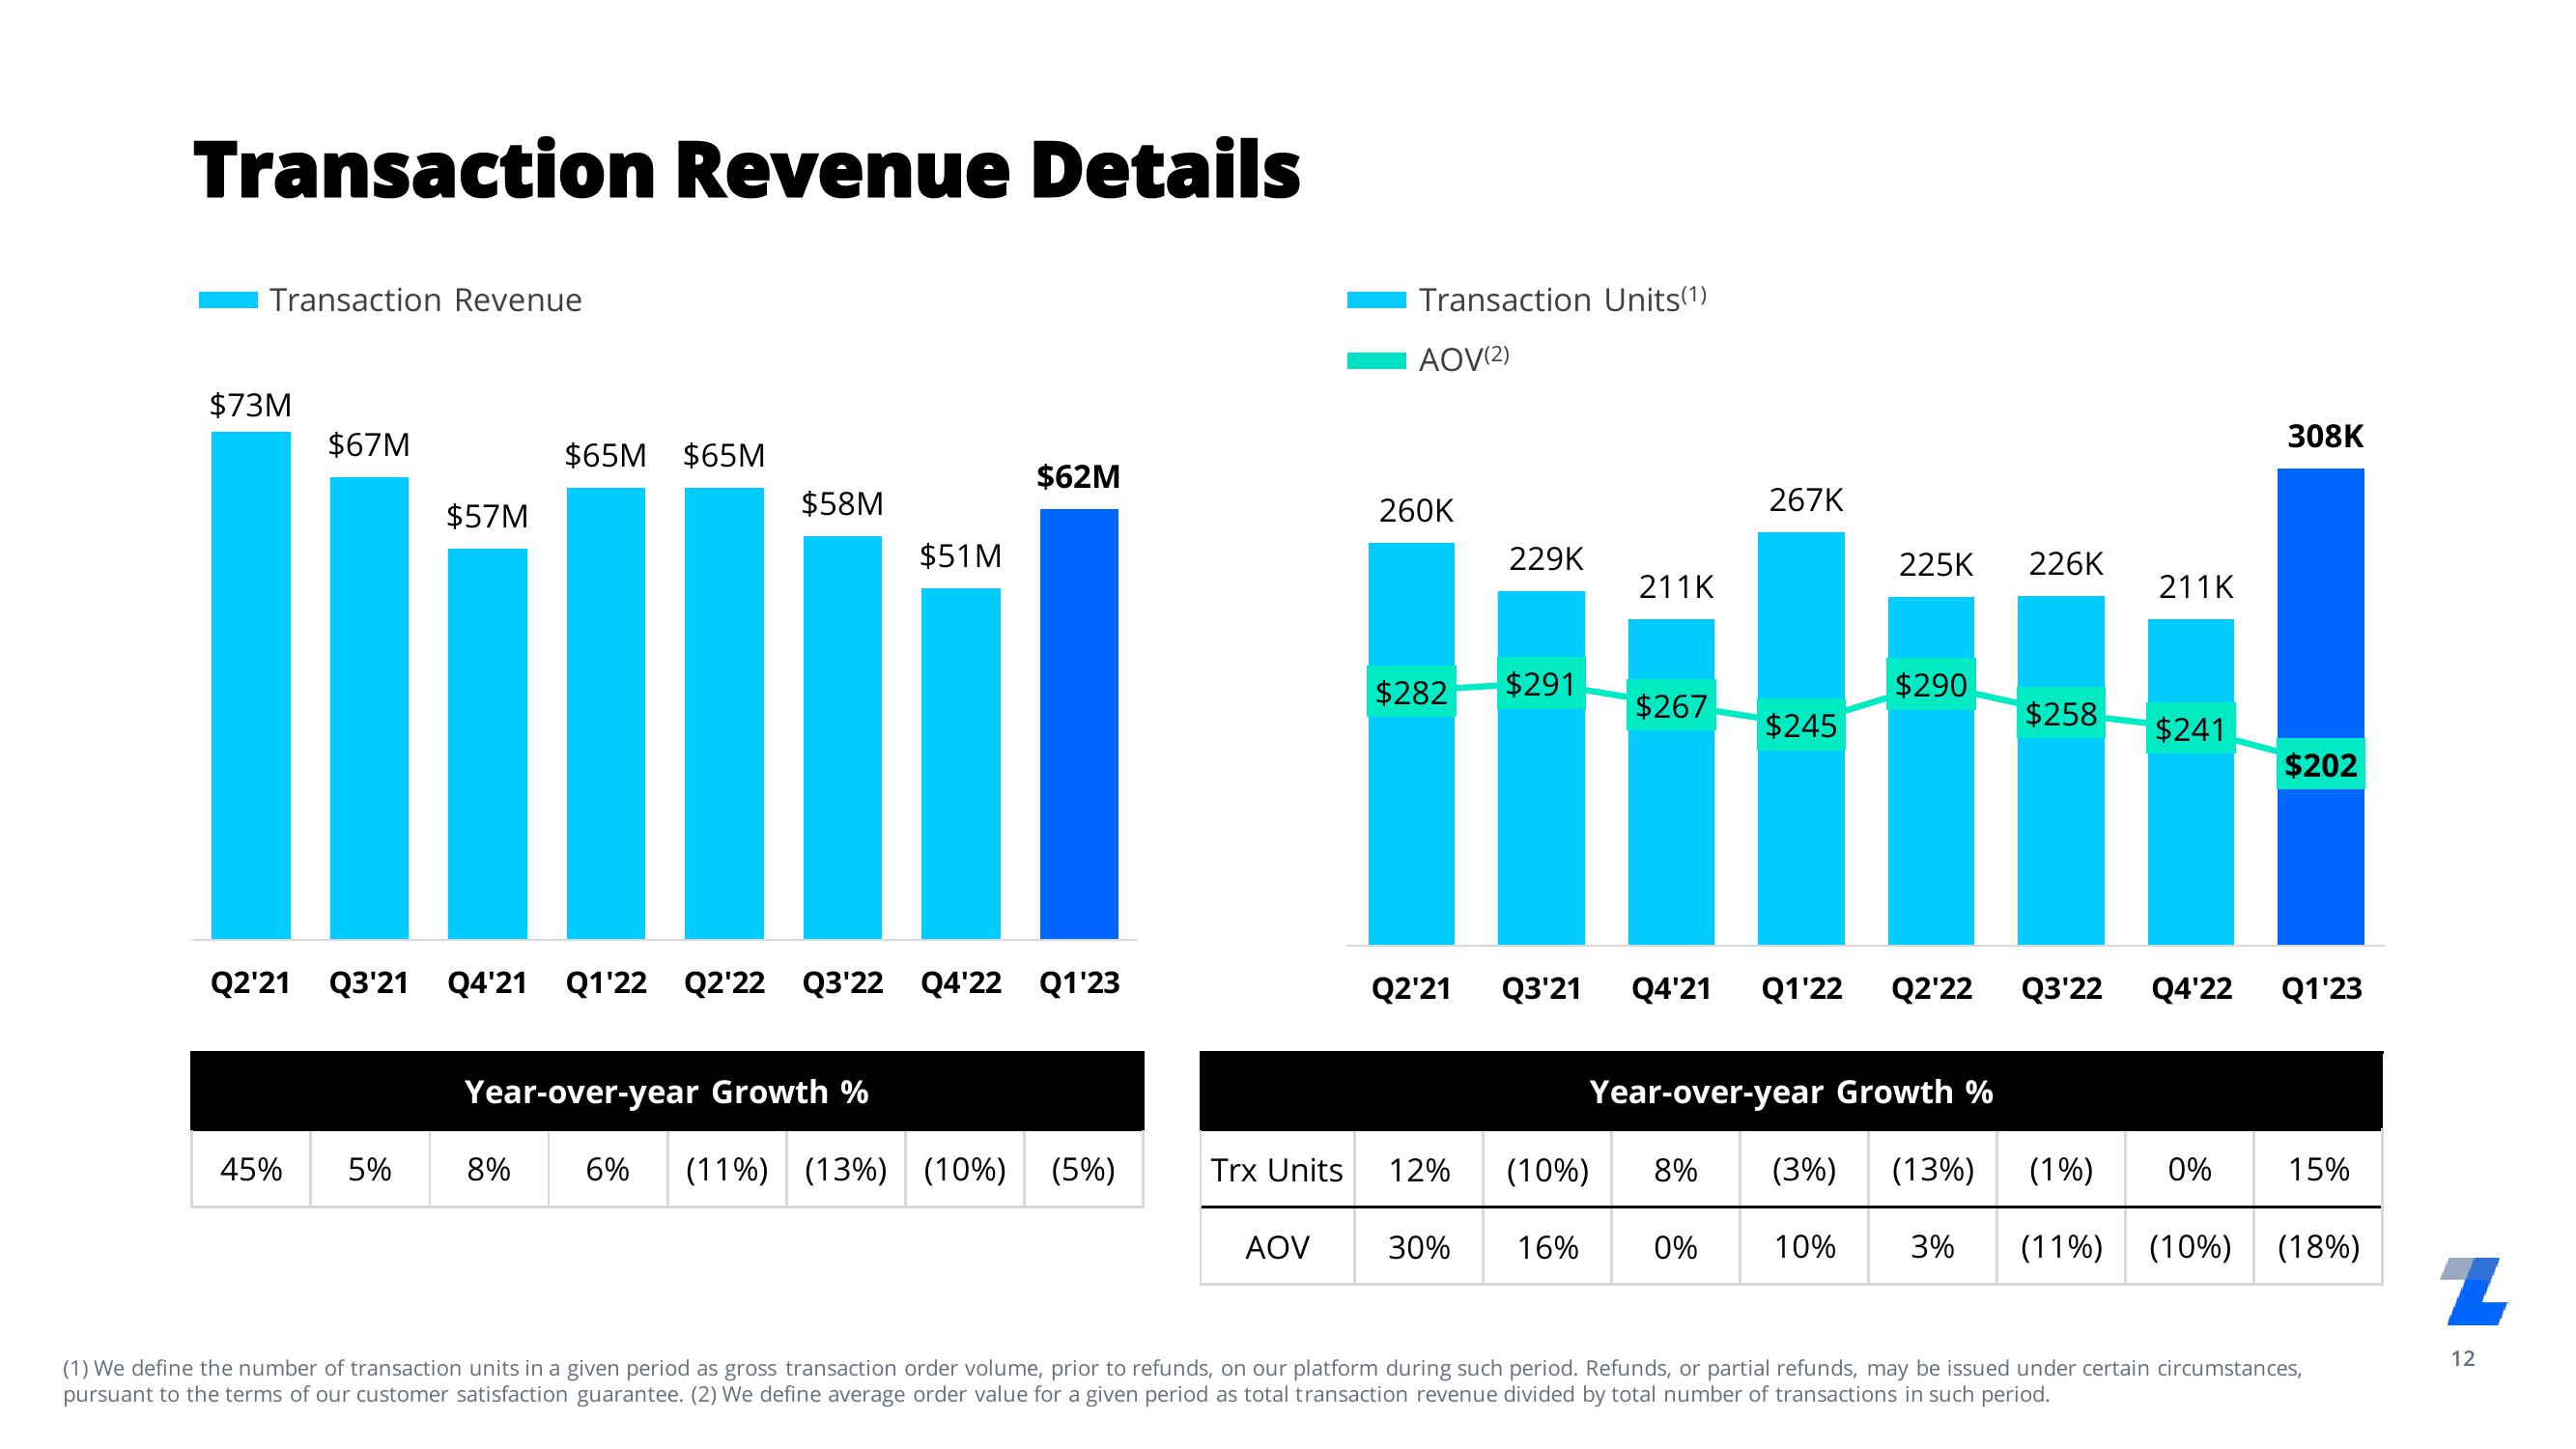
Transaction Revenue Details
Transaction Revenue
$73M
$67M
45%
$57M
5%
$65M $65M
$58M
Q2'21 Q3'21 Q4'21 Q1'22 Q2'22 Q3'22 Q4'22 Q1'23
8%
Year-over-year Growth %
$51M
$62M
6% (11%) (13%) (10%) (5%)
Trx Units
AOV
Transaction Units(1)
AOV(2)
260K
$282 $291
Q2'21
12%
229K
30%
Q3'21
211K
16%
$267
(10%) 8%
267K
$245
0%
225K 226K
Year-over-year Growth %
$290
Q4'21 Q1'22 Q2'22 Q3'22 Q4'22
10%
$258
211K
$241
(3%) (13%) (1%) 0%
308K
$202
Q1'23
15%
3% (11%) (10%) (18%)
(1) We define the number of transaction units in a given period as gross transaction order volume, prior to refunds, on our platform during such period. Refunds, or partial refunds, may be issued under certain circumstances,
pursuant to the terms of our customer satisfaction guarantee. (2) We define average order value for a given period as total transaction revenue divided by total number of transactions in such period.
Z
12View entire presentation