Palantir Results Presentation Deck
O)
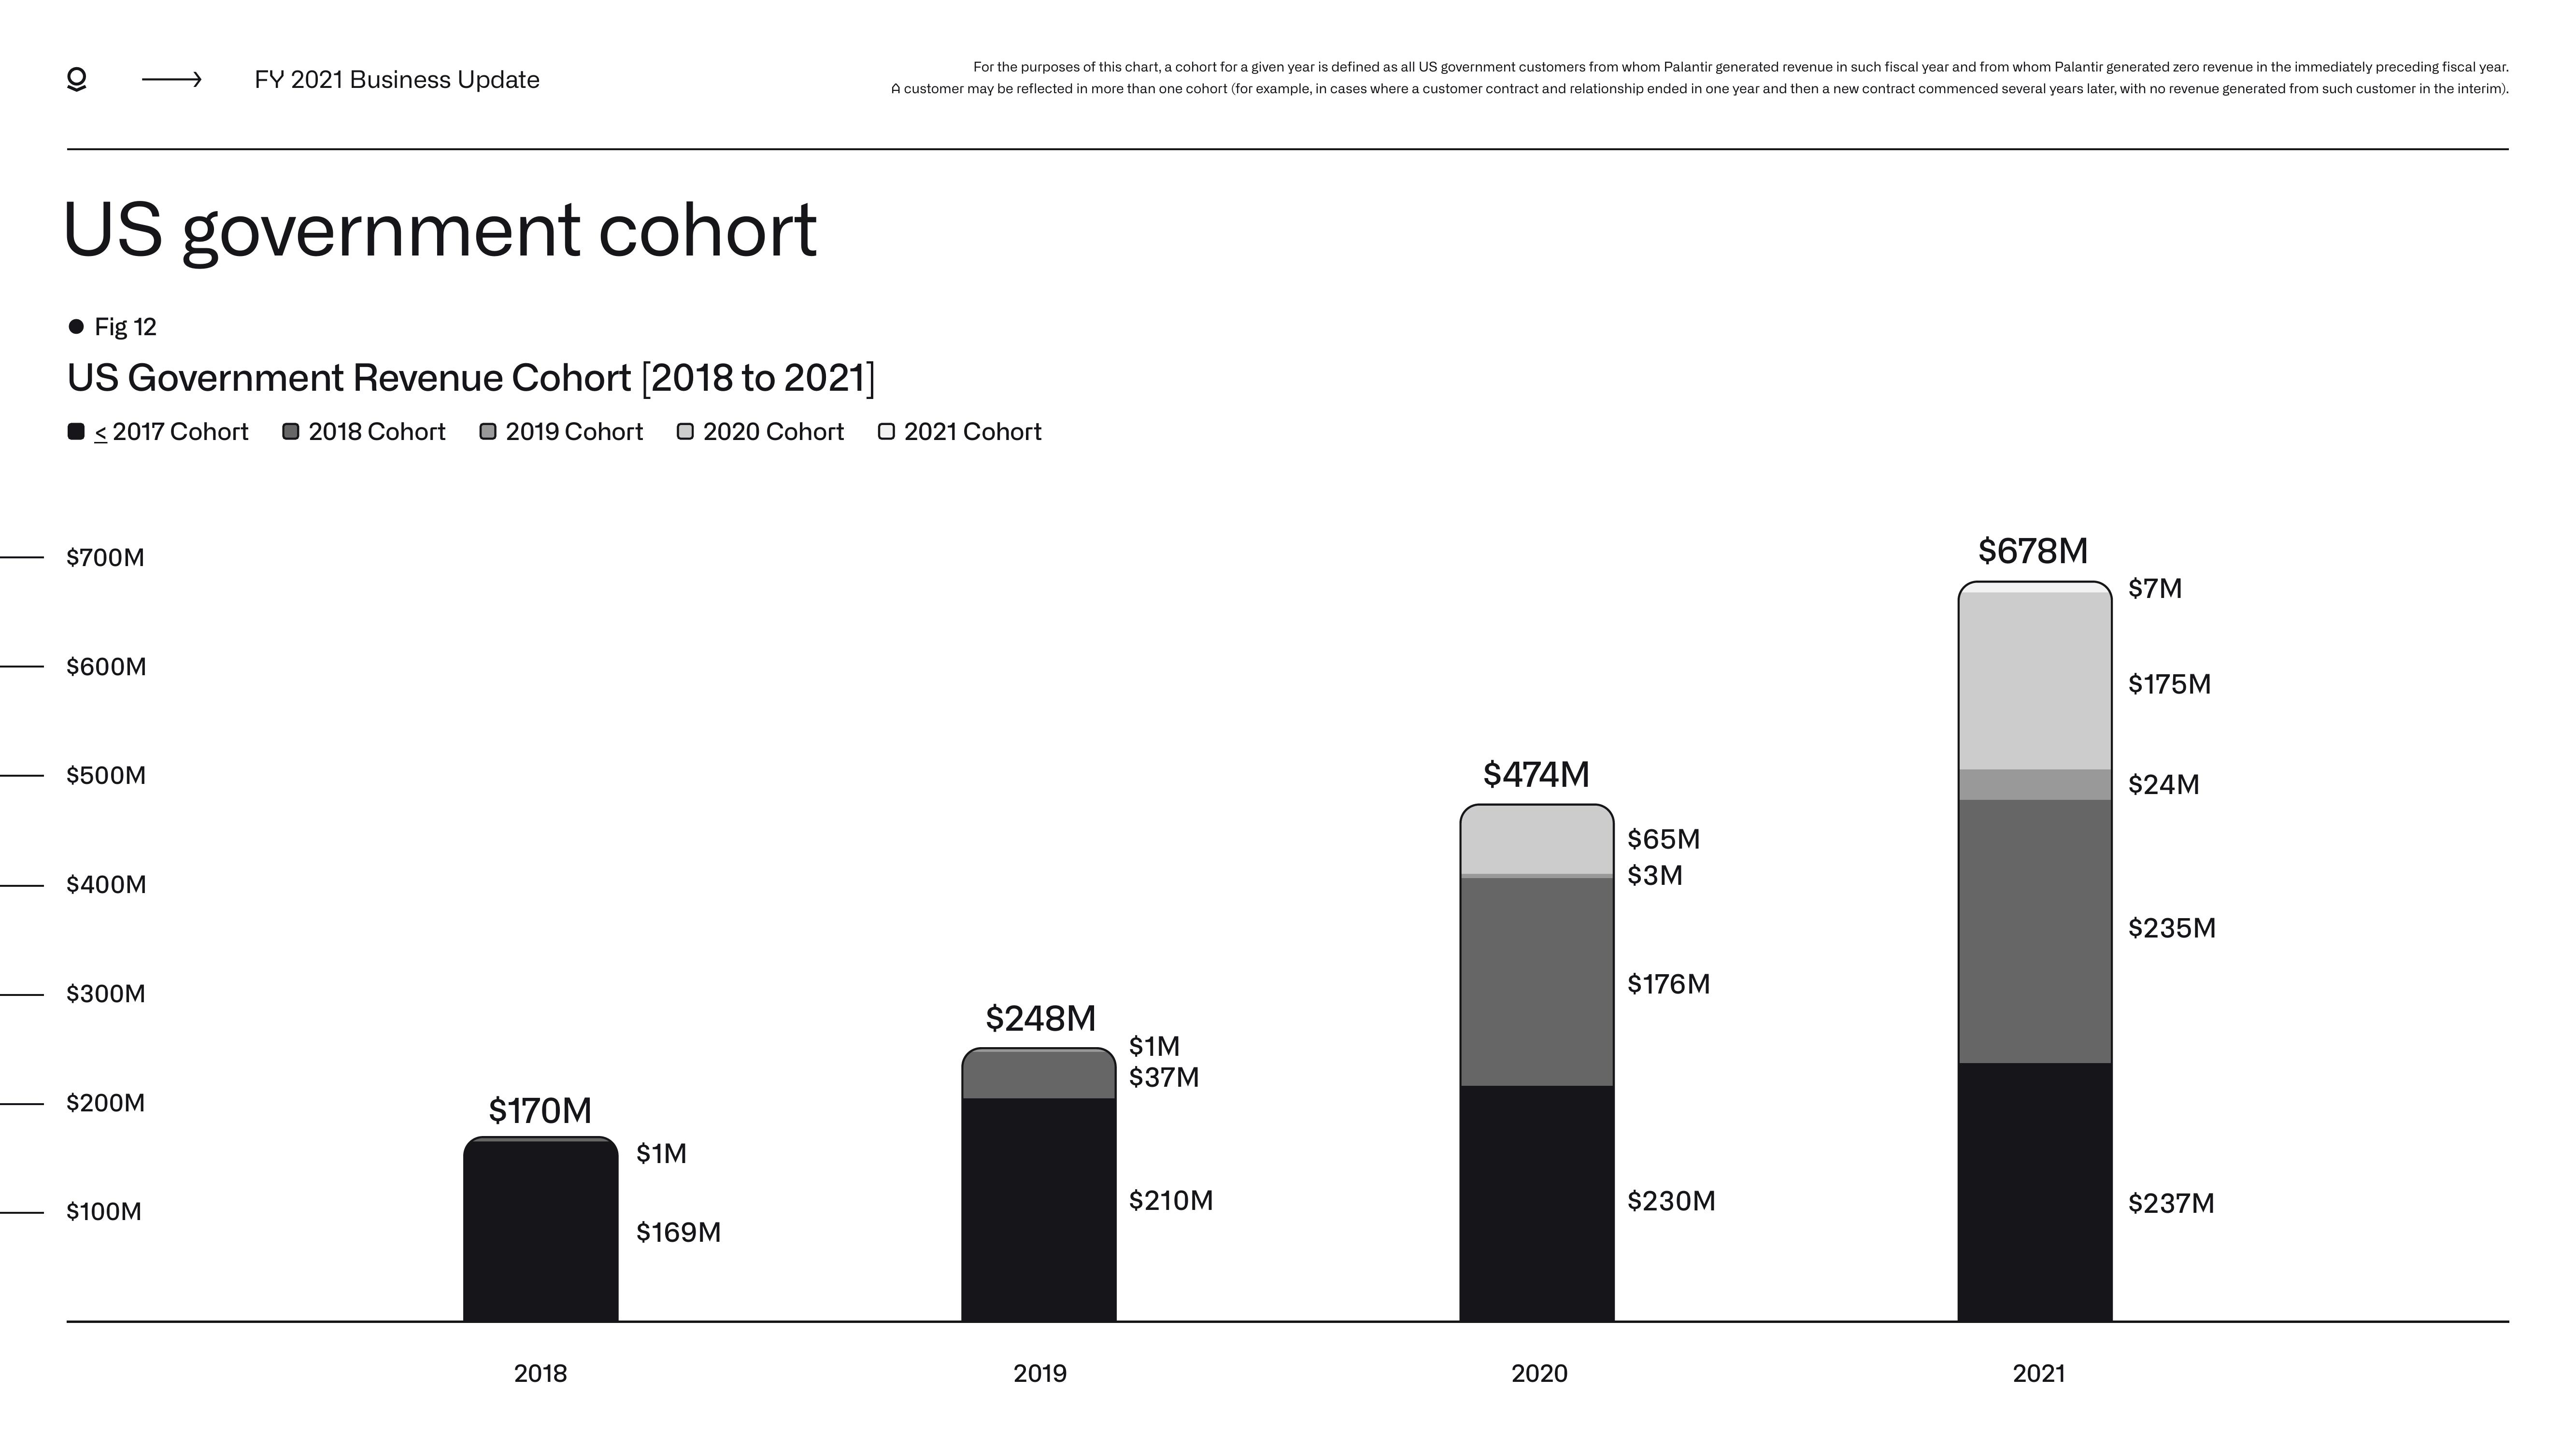
US government cohort
● Fig 12
US Government Revenue Cohort [2018 to 2021]
2017 Cohort
2018 Cohort
$700M
$600M
$500M
$400M
$300M
FY 2021 Business Update
$200M
$100M
2019 Cohort O 2020 Cohort O 2021 Cohort
$170M
2018
$1M
For the purposes of this chart, a cohort for a given year is defined as all US government customers from whom Palantir generated revenue such fiscal year and from whom Palantir generated zero revenue in the immediately preceding fiscal year.
A customer may be reflected in more than one cohort (for example, cases where a customer contract and relationship ended in one year and then a new contract commenced several years later, with no revenue generated from such customer in the interim).
$169M
$248M
2019
$1M
$37M
$210M
$474M
2020
$65M
$3M
$176M
$230M
$678M
2021
$7M
$175M
$24M
$235M
$237MView entire presentation