Hydrafacial Results Presentation Deck
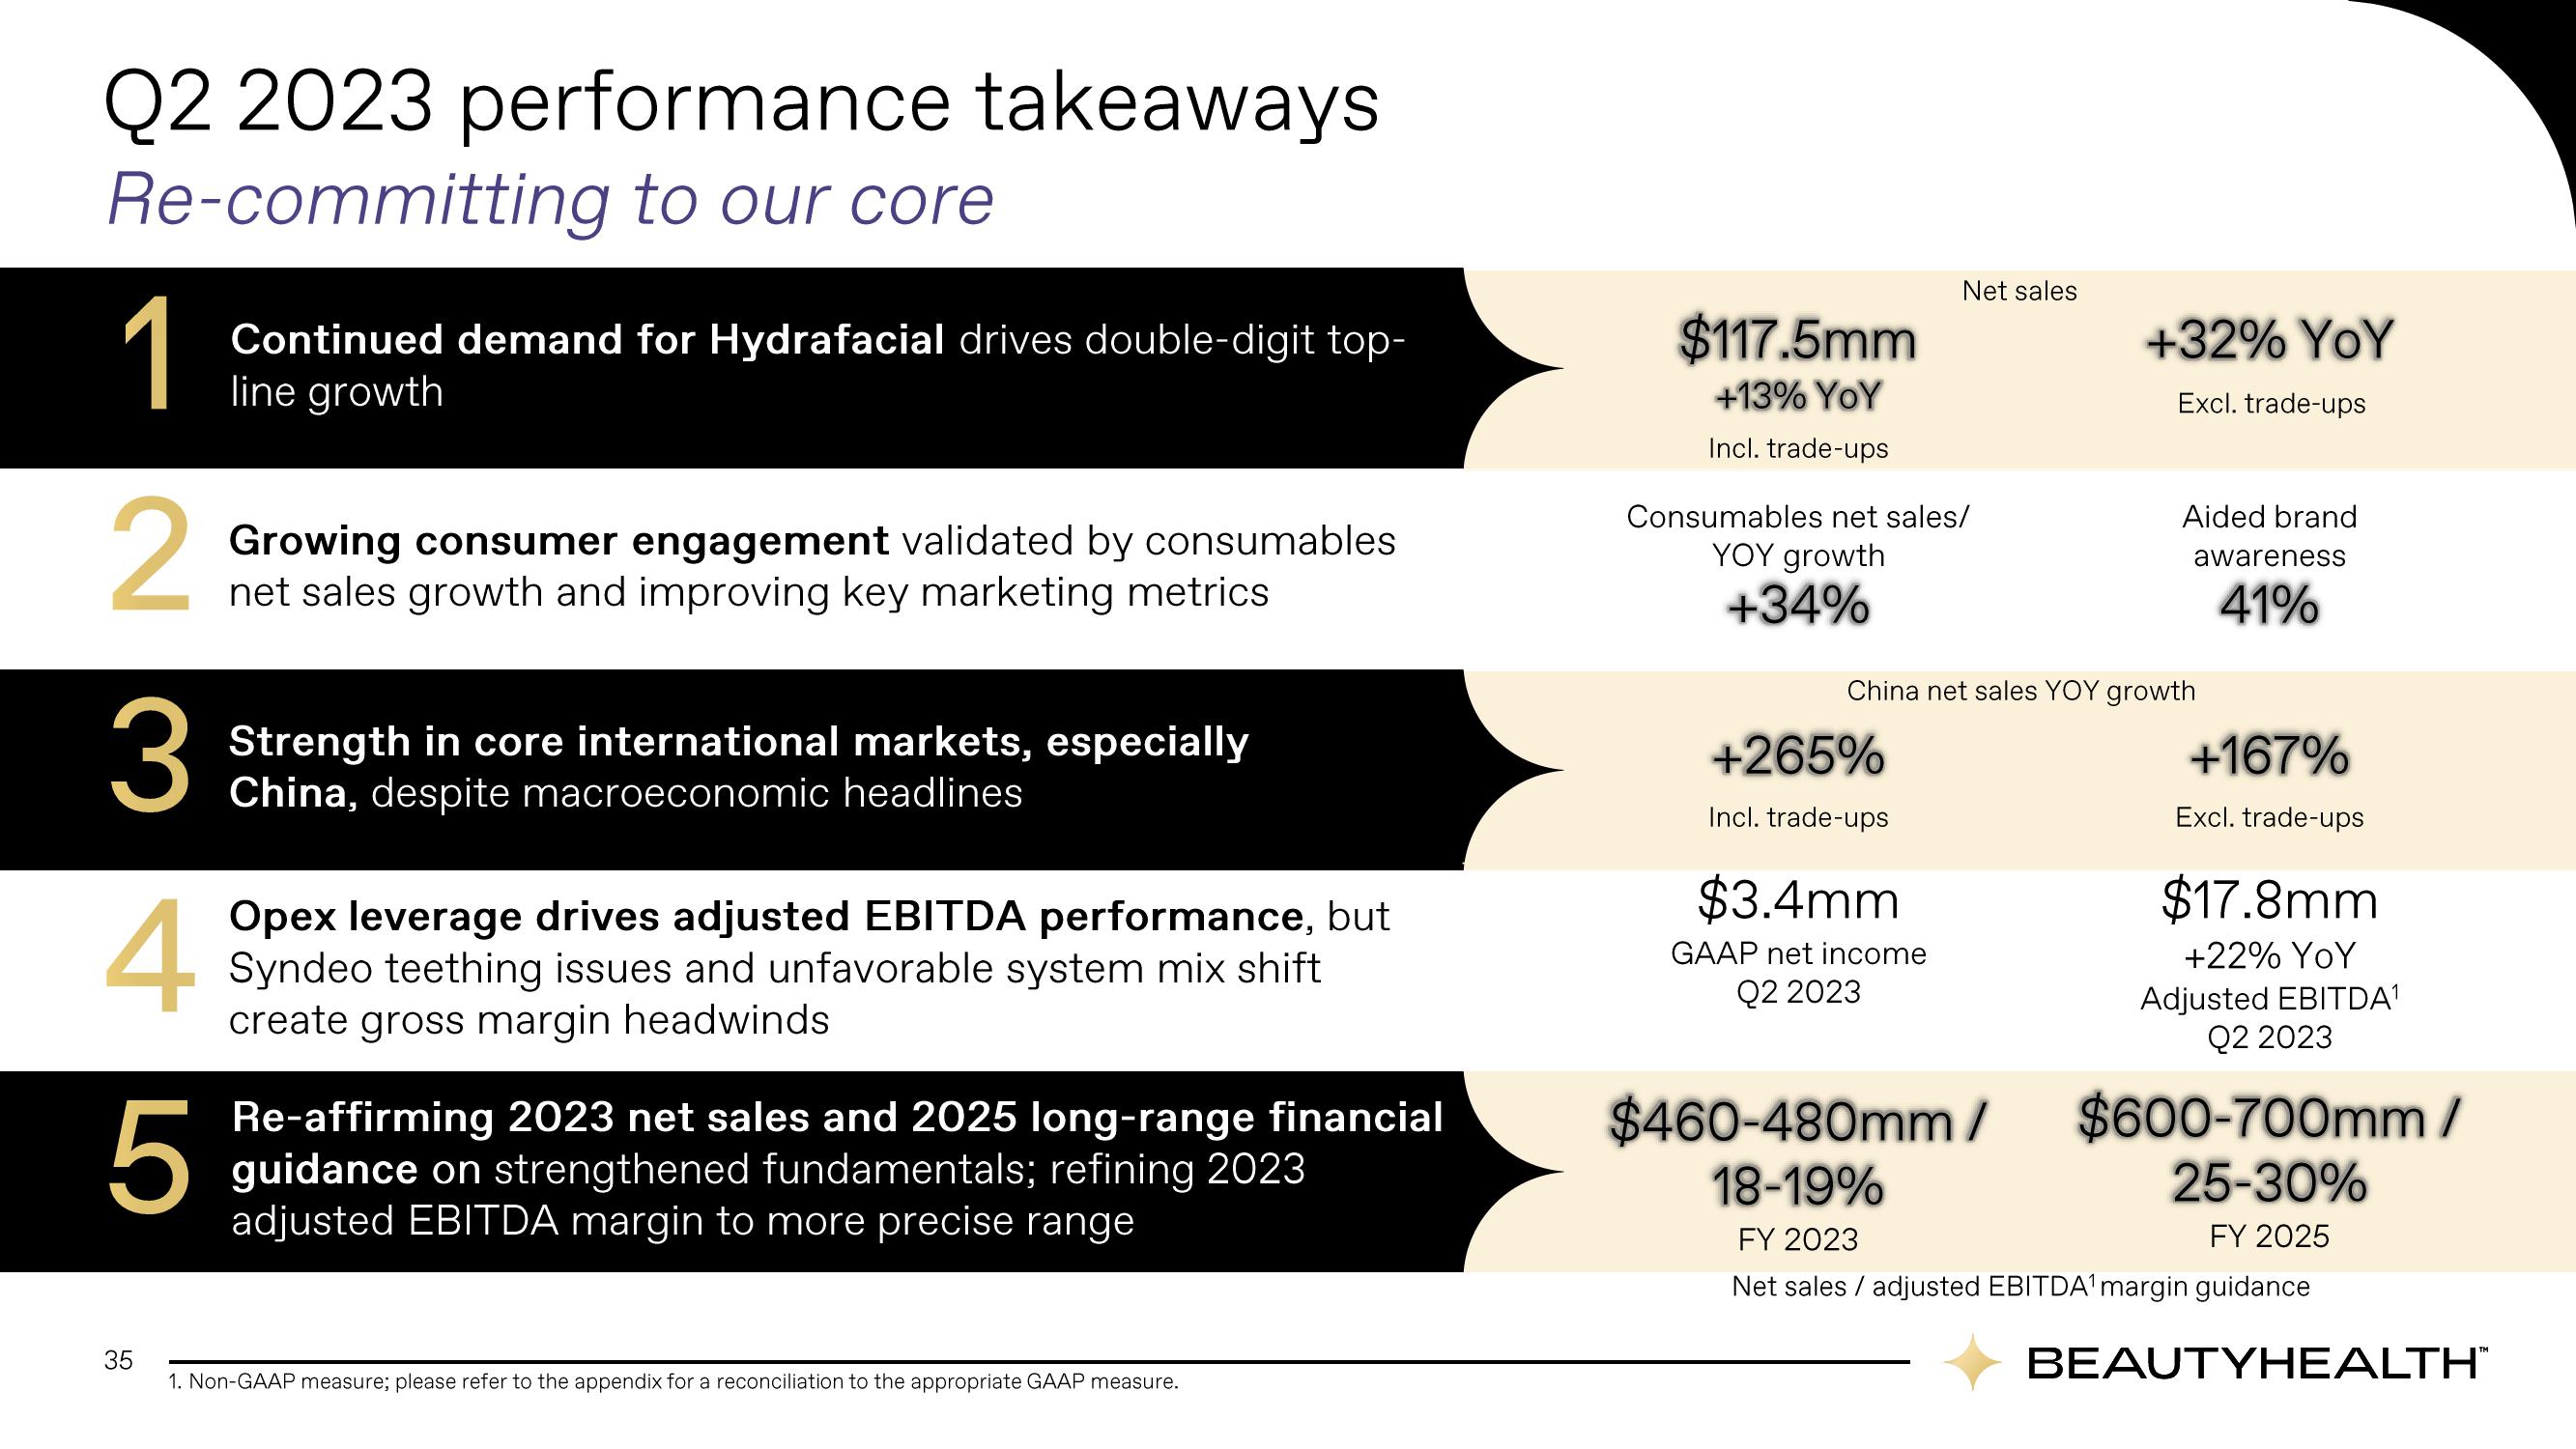
Q2 2023 performance takeaways
Re-committing to our core
1
Continued demand for Hydrafacial drives double-digit top-
line growth
2 Growing consumer engagement validated by consumables
growth and improving key marketing metrics
3
4
5
35
Strength in core international markets, especially
China, despite macroeconomic headlines
Opex leverage drives adjusted EBITDA performance, but
Syndeo teething issues and unfavorable system mix shift
create gross margin headwinds
Re-affirming 2023 net sales and 2025 long-range financial
guidance on strengthened fundamentals; refining 2023
adjusted EBITDA margin to more precise range
1. Non-GAAP measure; please refer to the appendix for a reconciliation to the appropriate GAAP measure.
$117.5mm
+13% YoY
Incl. trade-ups
Consumables net sales/
YOY growth
+34%
Net sales
+265%
Incl. trade-ups
$3.4mm
GAAP net income
Q2 2023
+32% YoY
Excl. trade-ups
China net sales YOY growth
Aided brand
$460-480mm/
18-19%
awareness
41%
+167%
Excl. trade-ups
$17.8mm
+22% YoY
Adjusted EBITDA¹
Q2 2023
$600-700mm /
25-30%
FY 2023
FY 2025
Net sales / adjusted EBITDA¹ margin guidance
BEAUTYHEALTH™View entire presentation