Grab Results Presentation Deck
Strong 2021 Q1 Top-Line Growth
Reaffirms Our Superapp Strategy
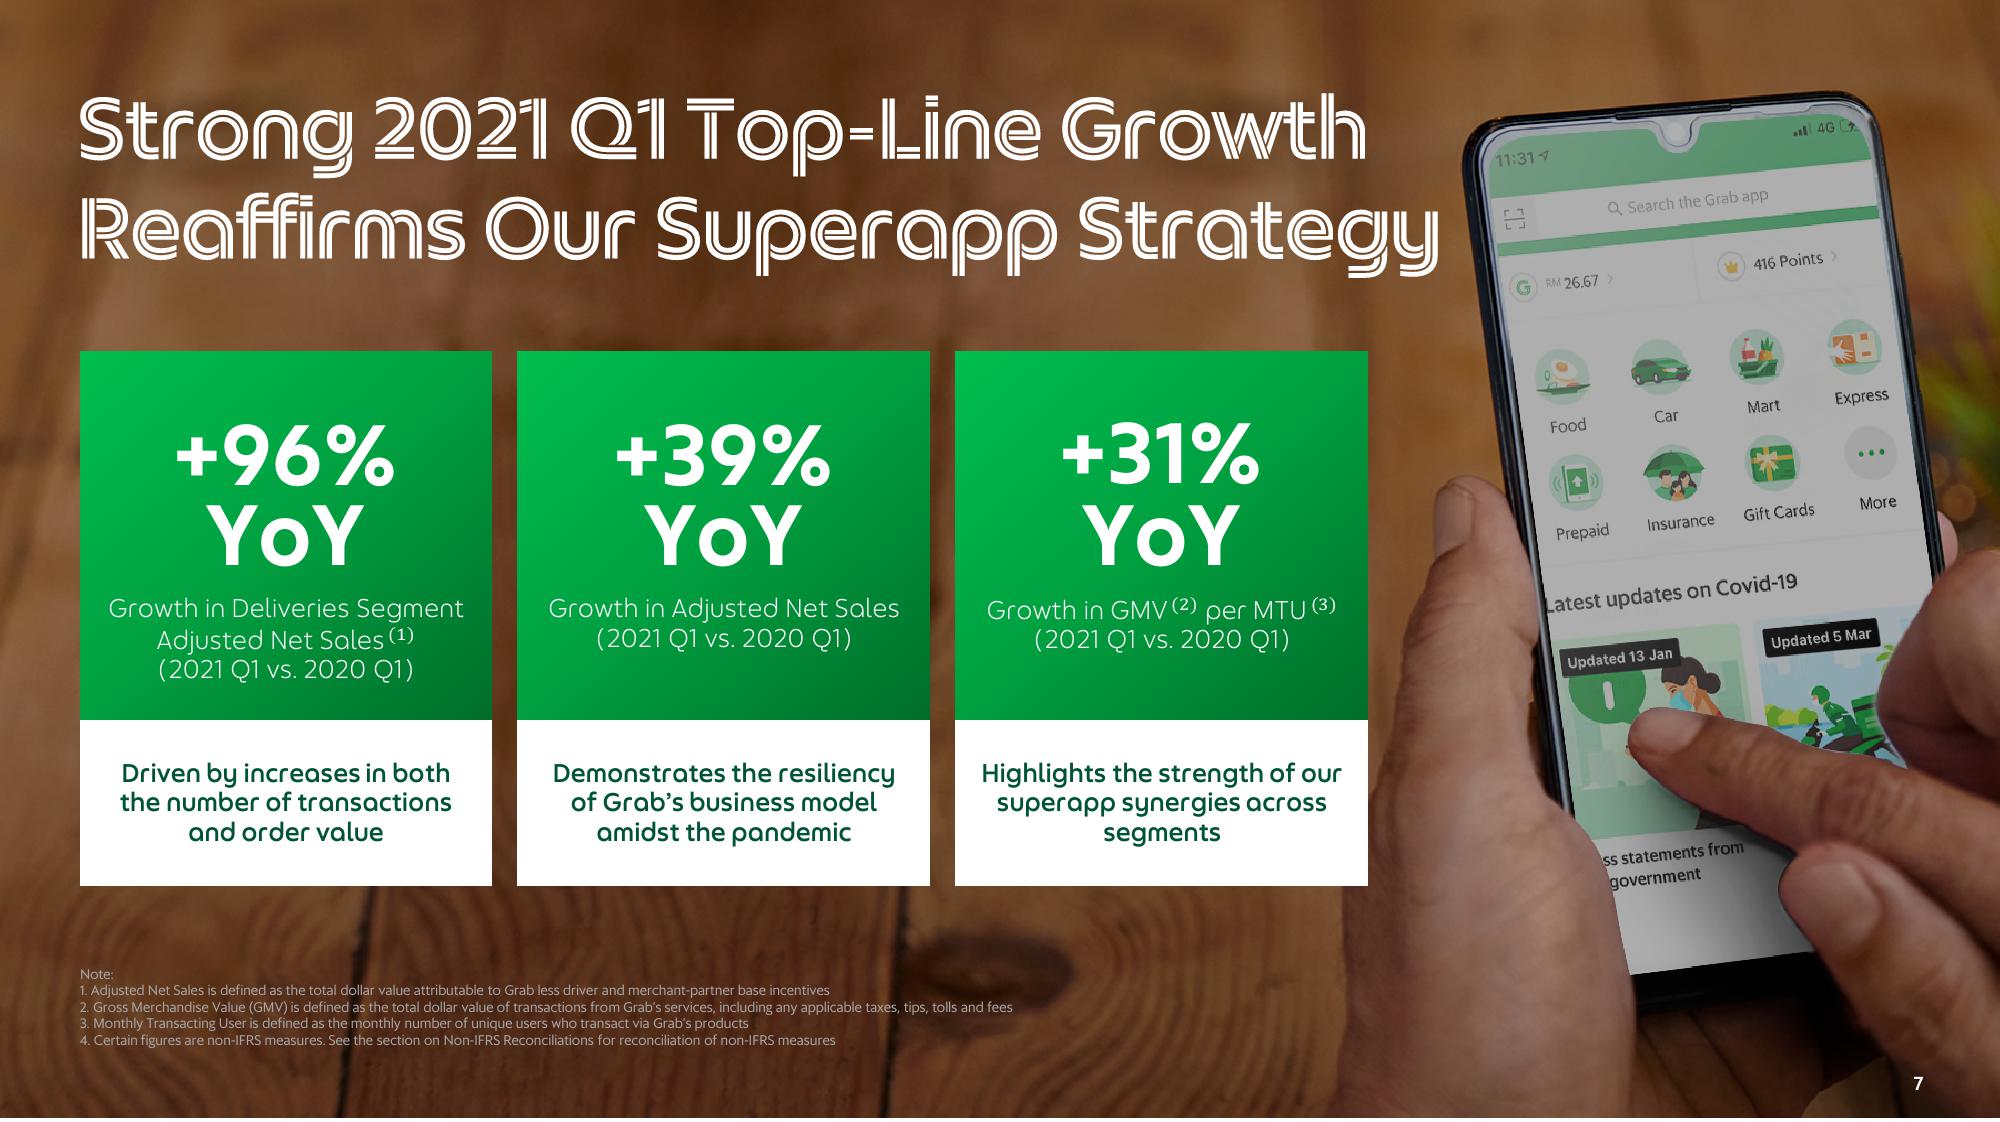
+96%
YOY
Growth in Deliveries Segment
Adjusted Net Sales (¹)
(2021 Q1 vs. 2020 Q1)
Driven by increases in both
the number of transactions
and order value
+39%
YOY
Growth in Adjusted Net Sales
(2021 Q1 vs. 2020 Q1)
Demonstrates the resiliency
of Grab's business model
amidst the pandemic
+31%
YOY
Growth in GMV (2) per MTU (3)
(2021 Q1 vs. 2020 Q1)
Highlights the strength of our
superapp synergies across
segments
Note:
1. Adjusted Net Sales is defined as the total dollar value attributable to Grab less driver and merchant-partner base incentives
2. Gross Merchandise Value (GMV) is defined as the total dollar value of transactions from Grab's services, including any applicable taxes, tips, tolls and fees
3. Monthly Transacting User is defined as the monthly number of unique users who transact via Grab's products
4. Certain figures are non-IFRS measures. See the section on Non-IFRS Reconciliations for reconciliation of non-IFRS measures
CAMILLE
11:31
163
Q Search the Grab app
RM 26.67 >
Food
Prepaid
Car
Insurance
W
Updated 13 Jan
416 Points >
Mart
Gift Cards
Latest updates on Covid-19
ss statements from
government
4G
Express
More
Updated 5 Mar
7View entire presentation