Despegar Results Presentation Deck
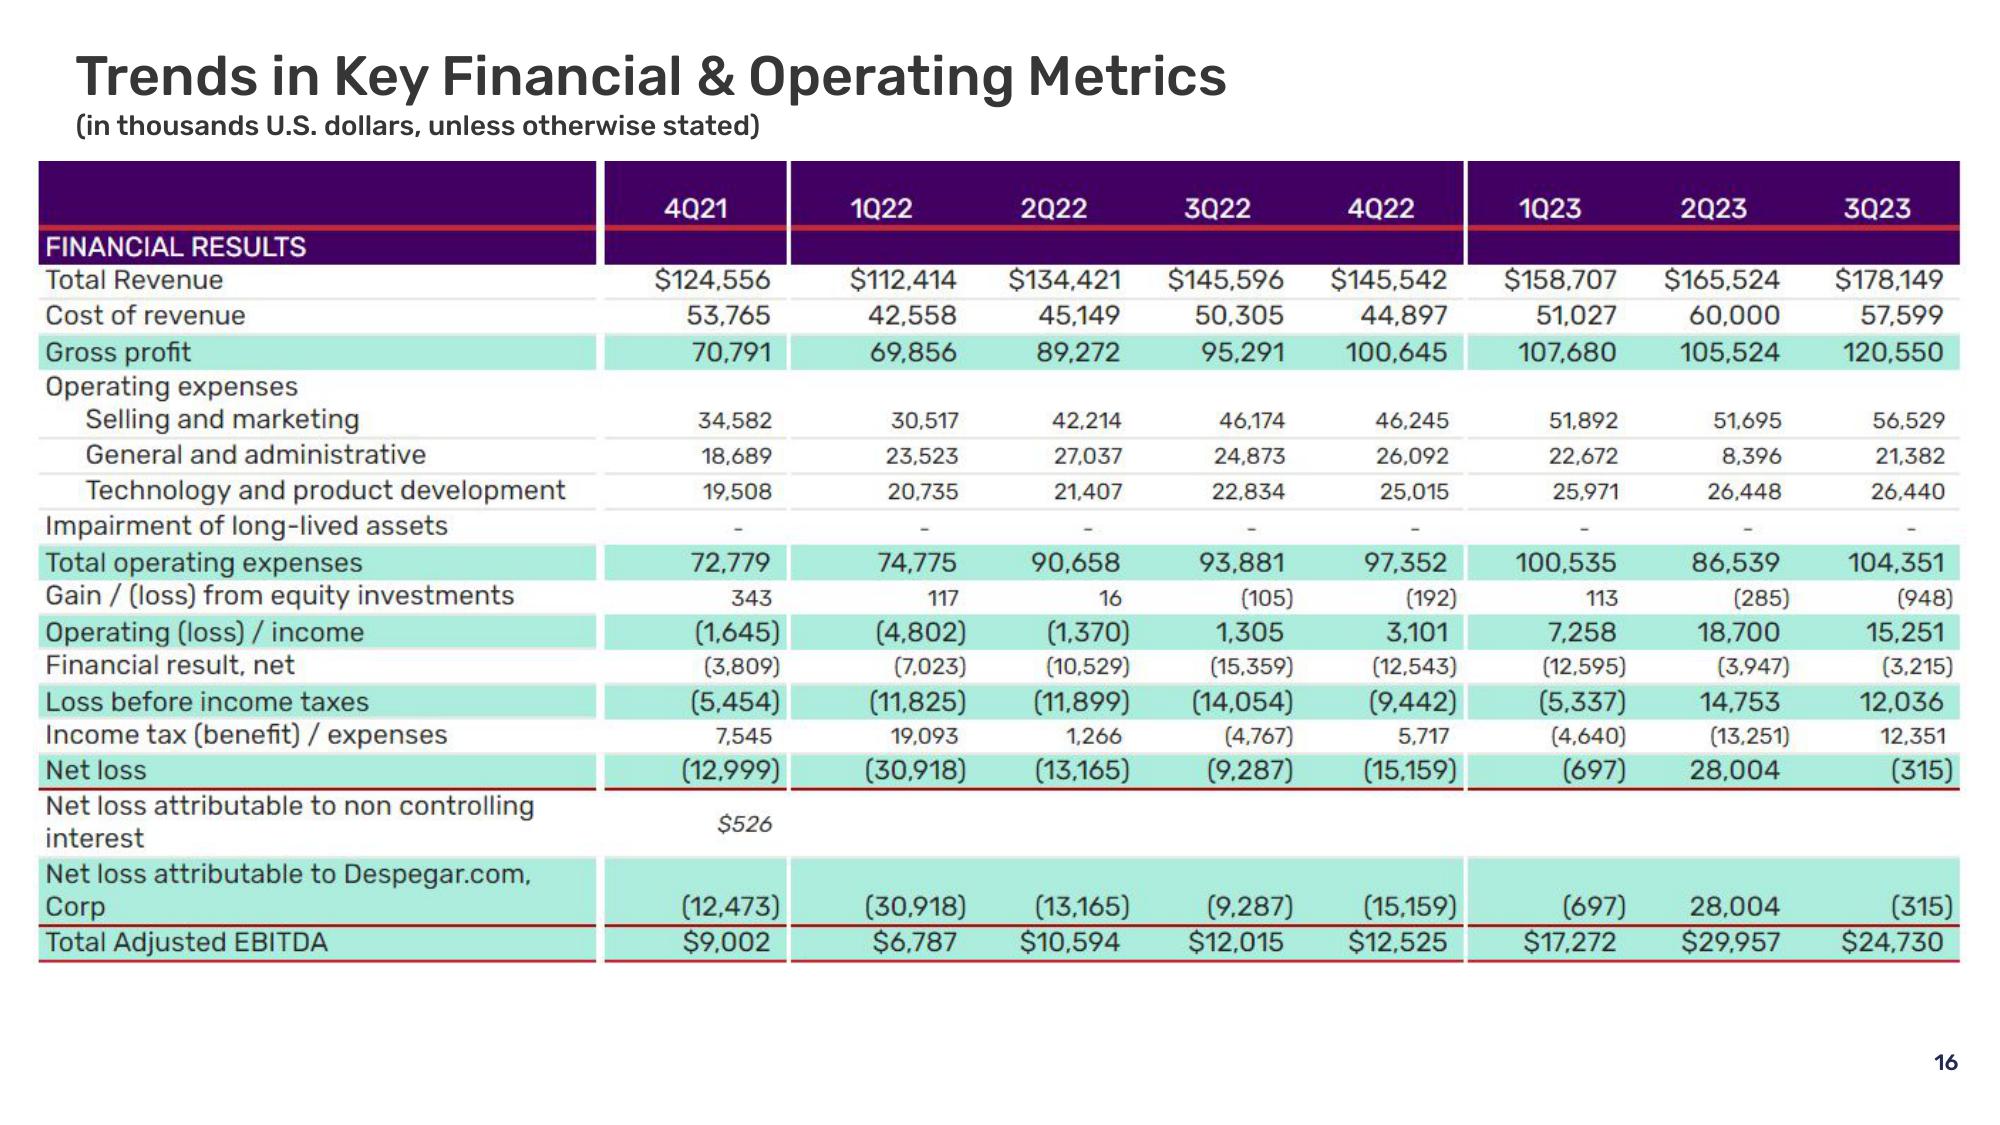
Trends in Key Financial & Operating Metrics
(in thousands U.S. dollars, unless otherwise stated)
FINANCIAL RESULTS
Total Revenue
Cost of revenue
Gross profit
Operating expenses
Selling and marketing
General and administrative
Technology and product development
Impairment of long-lived assets
Total operating expenses
Gain/ (loss) from equity investments
Operating (loss) / income
Financial result, net
Loss before income taxes
Income tax (benefit) / expenses
Net loss
Net loss attributable to non controlling
interest
Net loss attributable to Despegar.com,
Corp
Total Adjusted EBITDA
4021
$124,556
53,765
70,791
34,582
18,689
19,508
72,779
343
(1,645)
(3,809)
(5,454)
7,545
(12,999)
$526
(12,473)
$9,002
1022
$112,414
42,558
69,856
30,517
23,523
20,735
74,775
117
(4,802)
(7,023)
(11,825)
19,093
(30,918)
2022
$134,421 $145,596
45,149
89,272
42,214
27,037
21,407
3022
(30,918)
(13,165)
$6,787 $10,594
46,174
24,873
22,834
90,658
16
(1,370)
1,305
(10,529)
(15,359)
(11,899) (14,054)
1,266
(4,767)
(13,165)
(9,287)
50,305 44,897
95,291 100,645
4022
93,881
(105)
$145,542 $158,707 $165,524
51,027
60,000
107,680
105,524
46,245
26,092
25,015
97,352
(192)
3,101
(12,543)
(9,442)
5,717
(15,159)
1023
(9,287)
(15,159)
$12,015 $12,525
51,892
22,672
25,971
2023
(697)
$17,272
51,695
8,396
26,448
100,535
113
7,258
(12,595)
(5,337)
(4,640)
(13,251)
(697) 28,004
86,539
(285)
18,700
(3,947)
14,753
3023
$178,149
57,599
120,550
56,529
21,382
26,440
104,351
(948)
15,251
(3.215)
12,036
12,351
(315)
(315)
28,004
$29,957 $24,730
16View entire presentation