Blend Results Presentation Deck
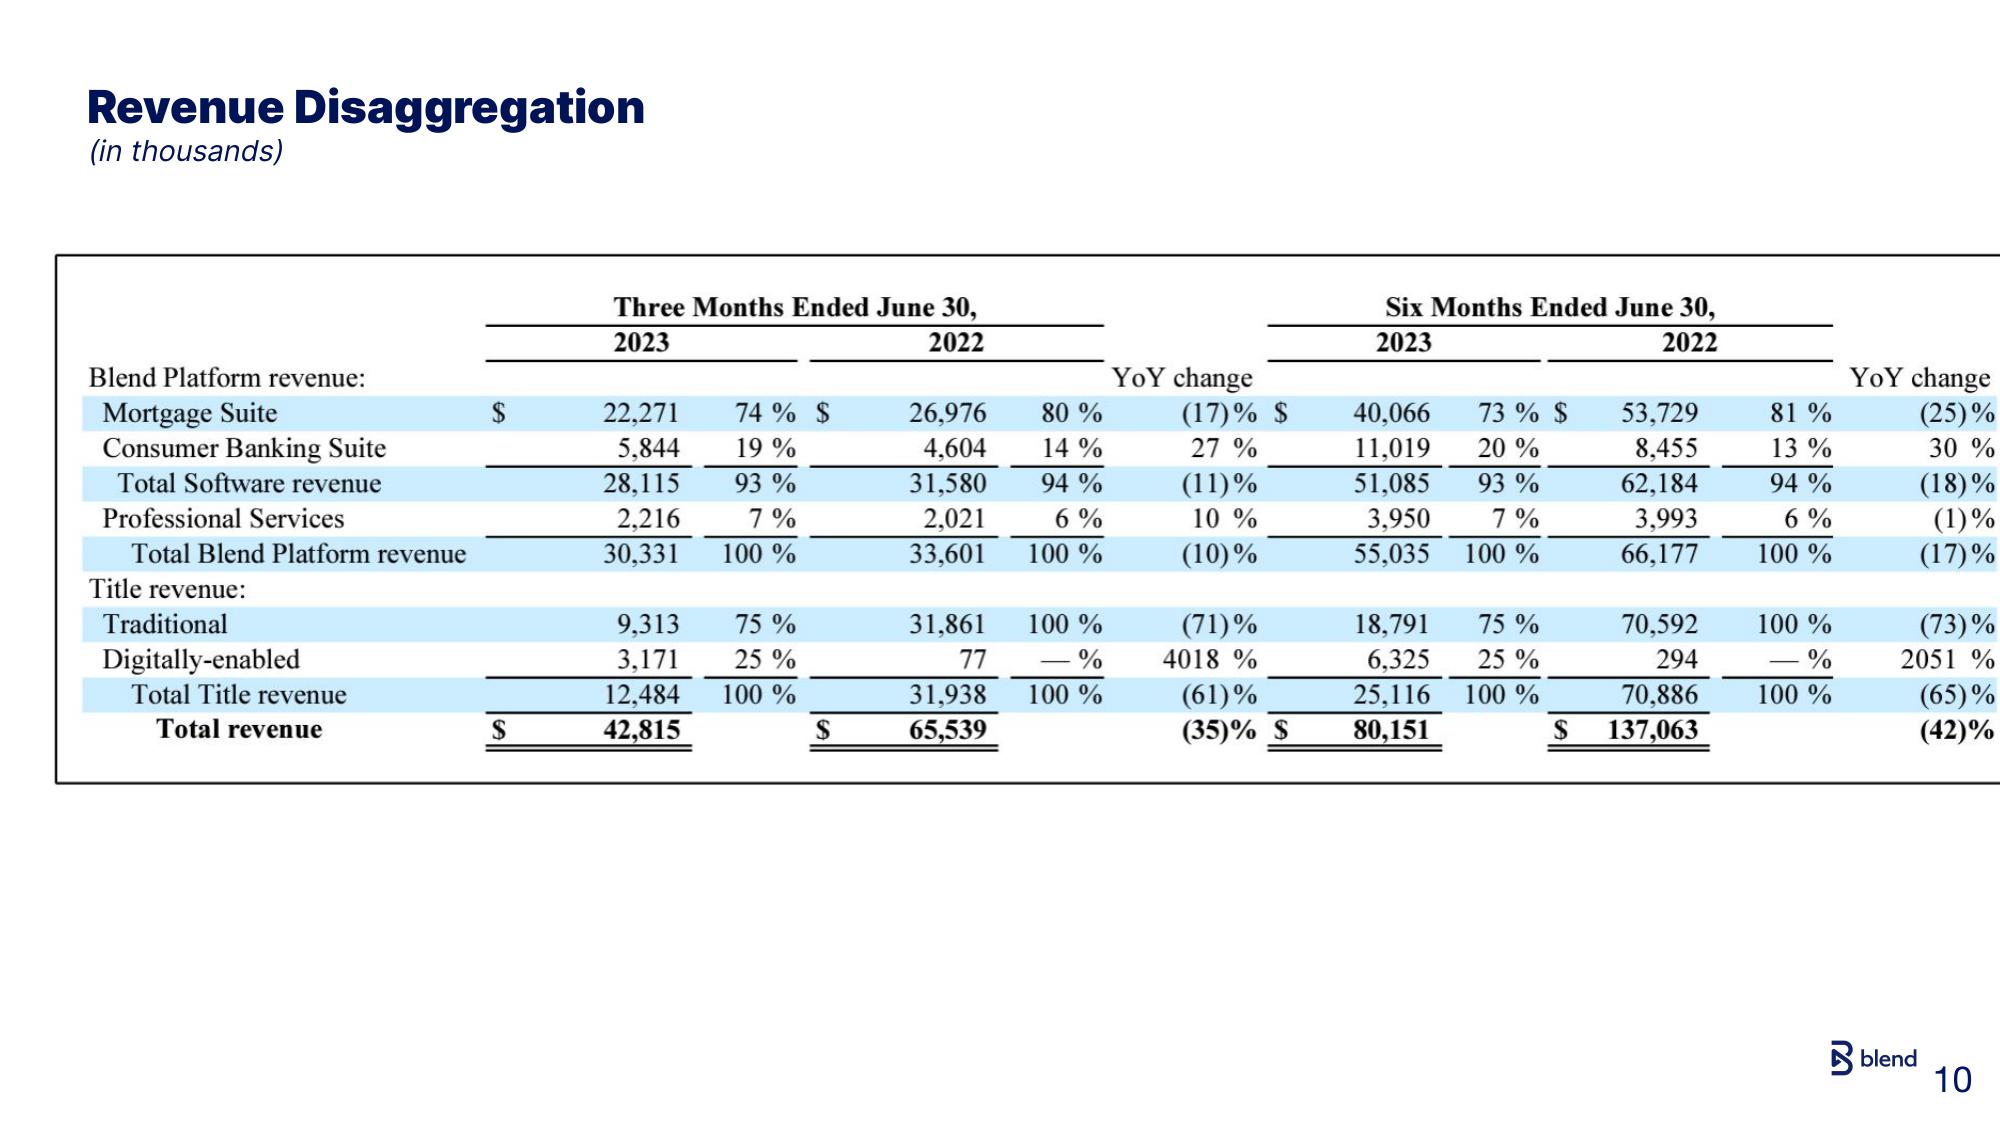
Revenue Disaggregation
(in thousands)
Blend Platform revenue:
Mortgage Suite
Consumer Banking Suite
Total Software revenue
Professional Services
Total Blend Platform revenue
Title revenue:
Traditional
Digitally-enabled
Total Title revenue
Total revenue
$
$
Three Months Ended June 30,
2023
2022
22,271
5,844
28,115
2,216
30,331
74% $
19%
93 %
7%
100 %
9,313
75 %
3,171
25%
12,484 100 %
42,815
$
26,976
4,604
31,580
2,021
33,601
31,861
77
31,938
65,539
80%
14%
94%
6%
100 %
100 %
%
100 %
YoY change
(17)% $
27%
(11)%
10 %
(10)%
(71)%
4018 %
(61)%
(35)% S
Six Months Ended June 30,
2023
2022
40,066
11,019
51,085
3,950
55,035 100%
73 % $
20%
93 %
7%
18,791
6,325
25,116
80,151
75 %
25%
100 %
$
53,729
8,455
62,184
3,993
66,177
70,592
294
70,886
137,063
81%
13%
94%
6%
100 %
100 %
%
100 %
YoY change
(25)%
30 %
(18)%
(1)%
(17)%
(73)%
2051 %
(65)%
(42)%
blend
10View entire presentation