OppFi SPAC Presentation Deck
35
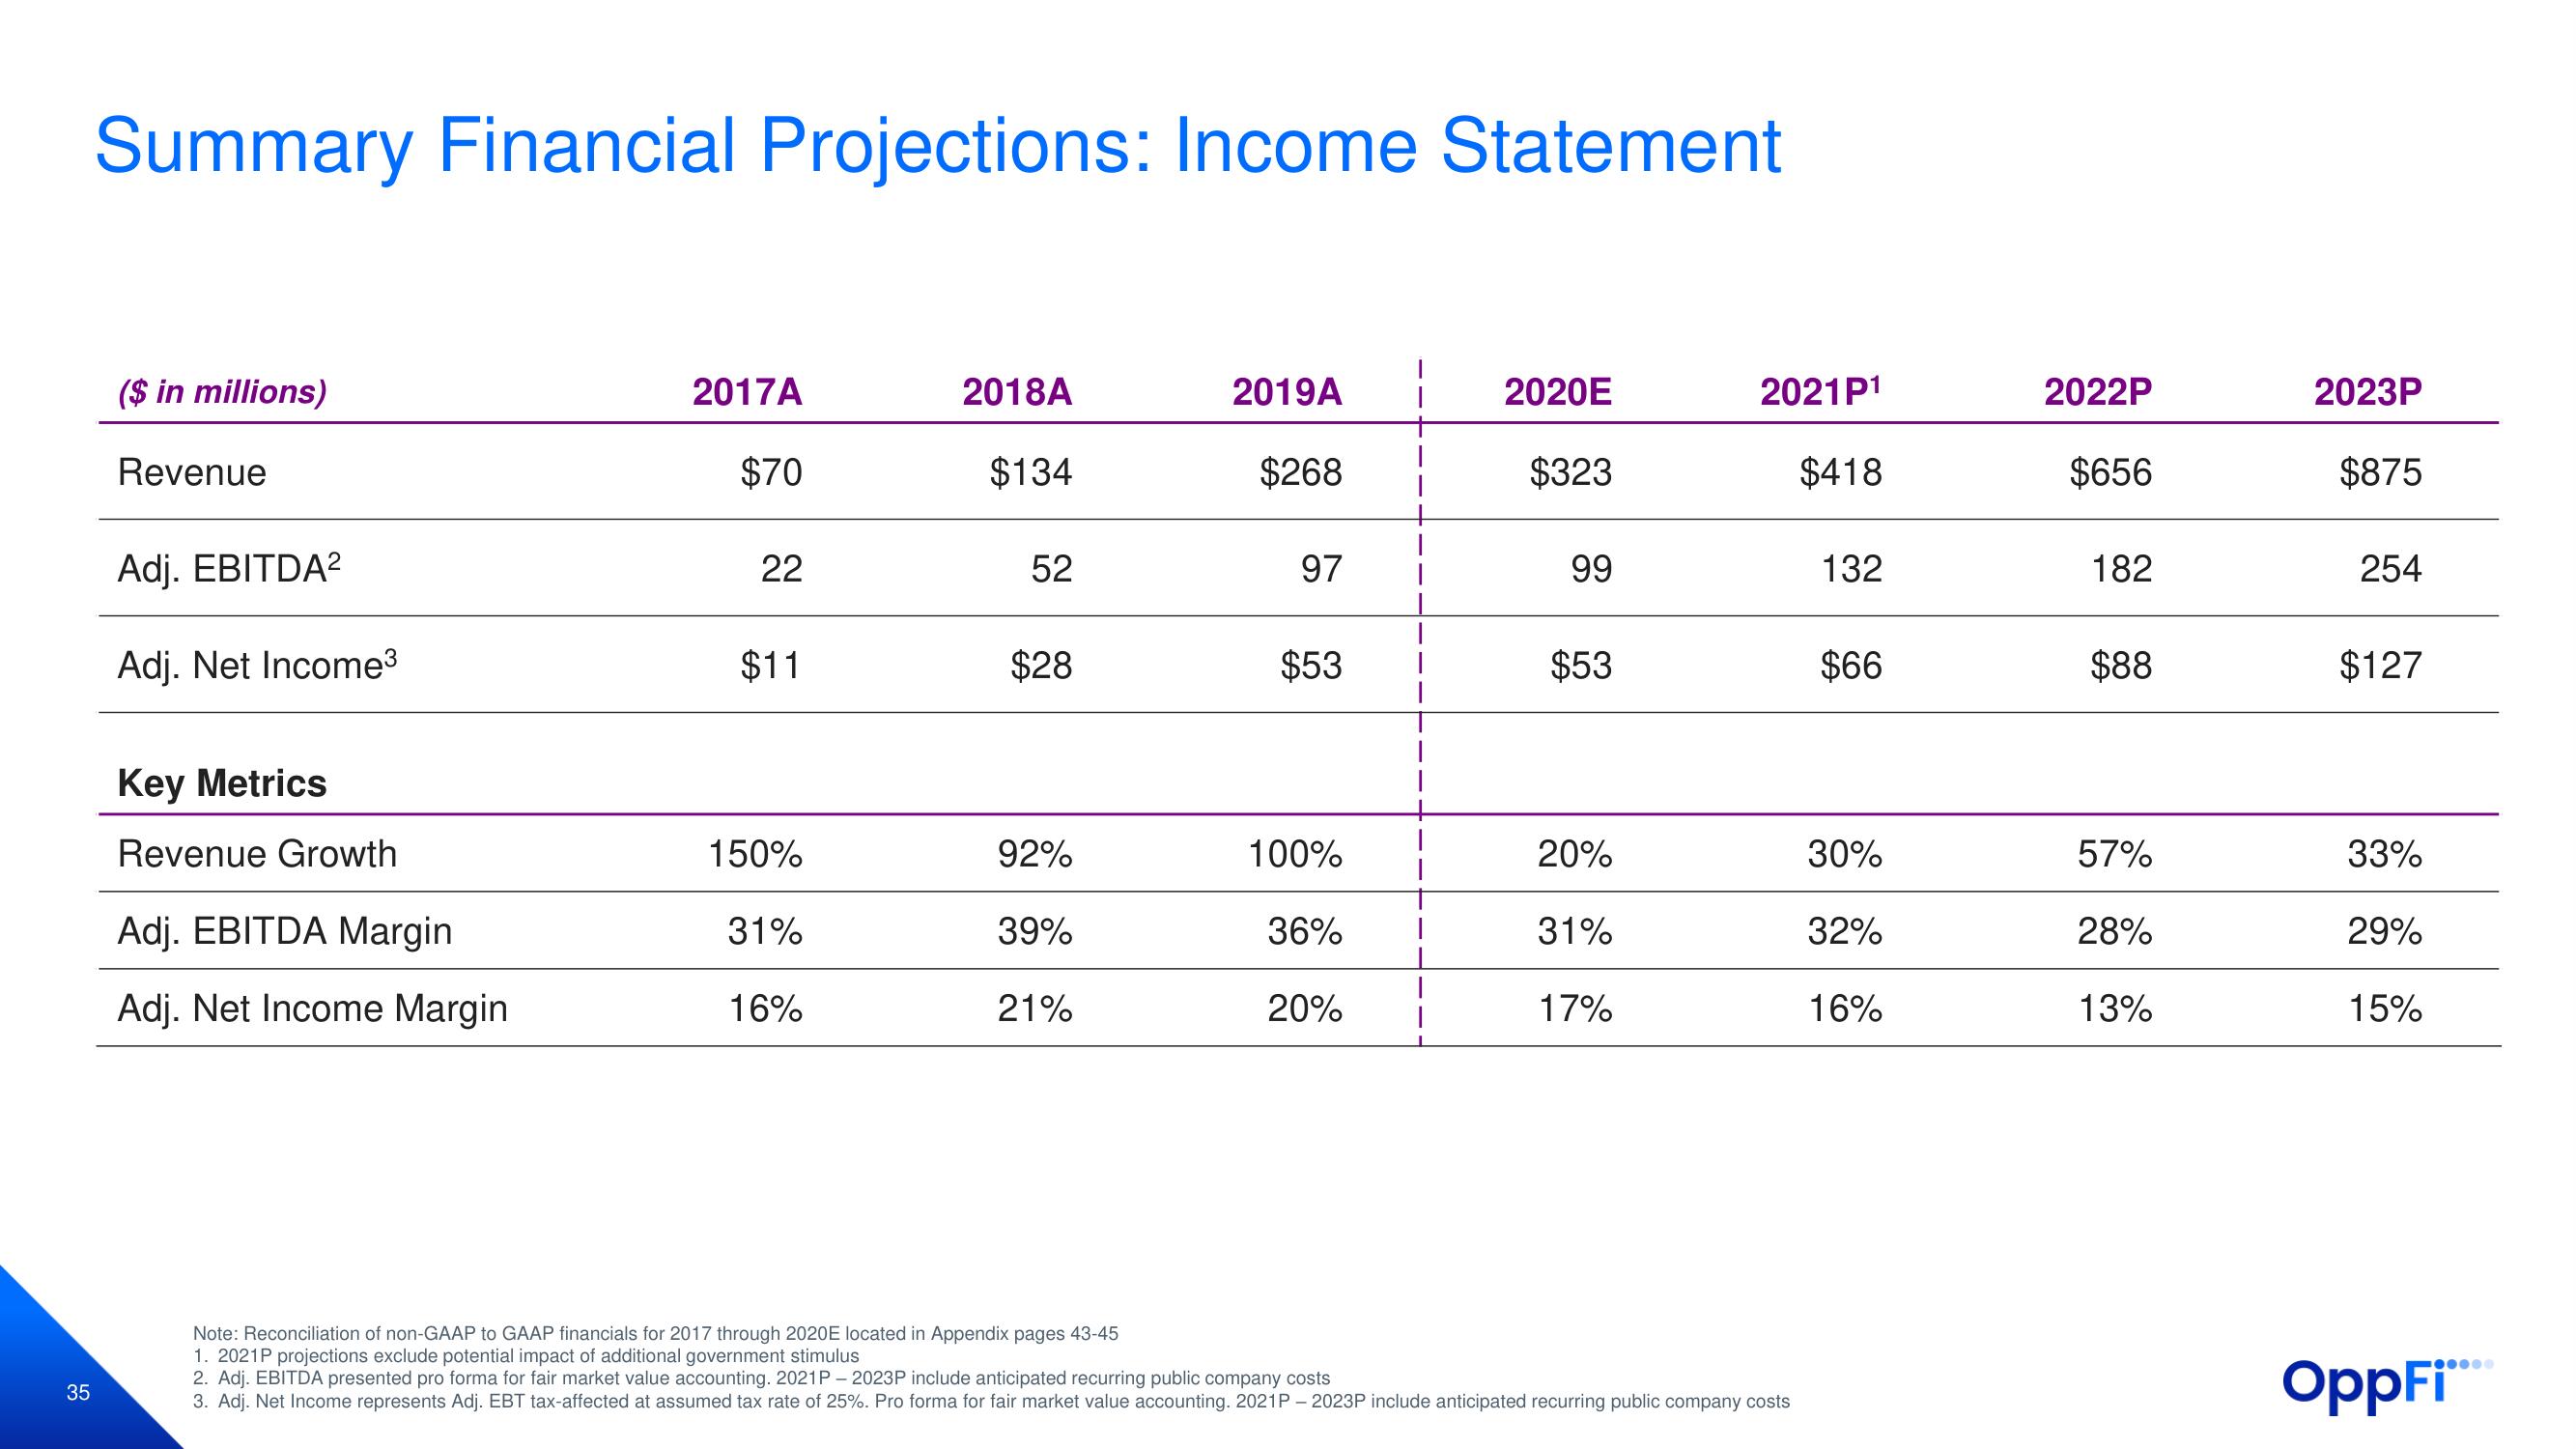
Summary Financial Projections: Income Statement
($ in millions)
Revenue
Adj. EBITDA²
Adj. Net Income³
Key Metrics
Revenue Growth
Adj. EBITDA Margin
Adj. Net Income Margin
2017A
$70
22
$11
150%
31%
16%
2018A
$134
52
$28
92%
39%
21%
2019A
$268
97
$53
100%
36%
20%
2020E
$323
99
$53
20%
31%
17%
2021P1
$418
Note: Reconciliation of non-GAAP to GAAP financials for 2017 through 2020E located in Appendix pages 43-45
1. 2021P projections exclude potential impact of additional government stimulus
2. Adj. EBITDA presented pro forma for fair market value accounting. 2021 P - 2023P include anticipated recurring public company costs
3. Adj. Net Income represents Adj. EBT tax-affected at assumed tax rate of 25%. Pro forma for fair market value accounting. 2021P - 2023P include anticipated recurring public company costs
132
$66
30%
32%
16%
2022P
$656
182
$88
57%
28%
13%
2023P
$875
254
$127
33%
29%
15%
OppFi****View entire presentation