Fiscal First Quarter 2022 Financial Results
Fiscal First Quarter 2022 Results
●
●
●
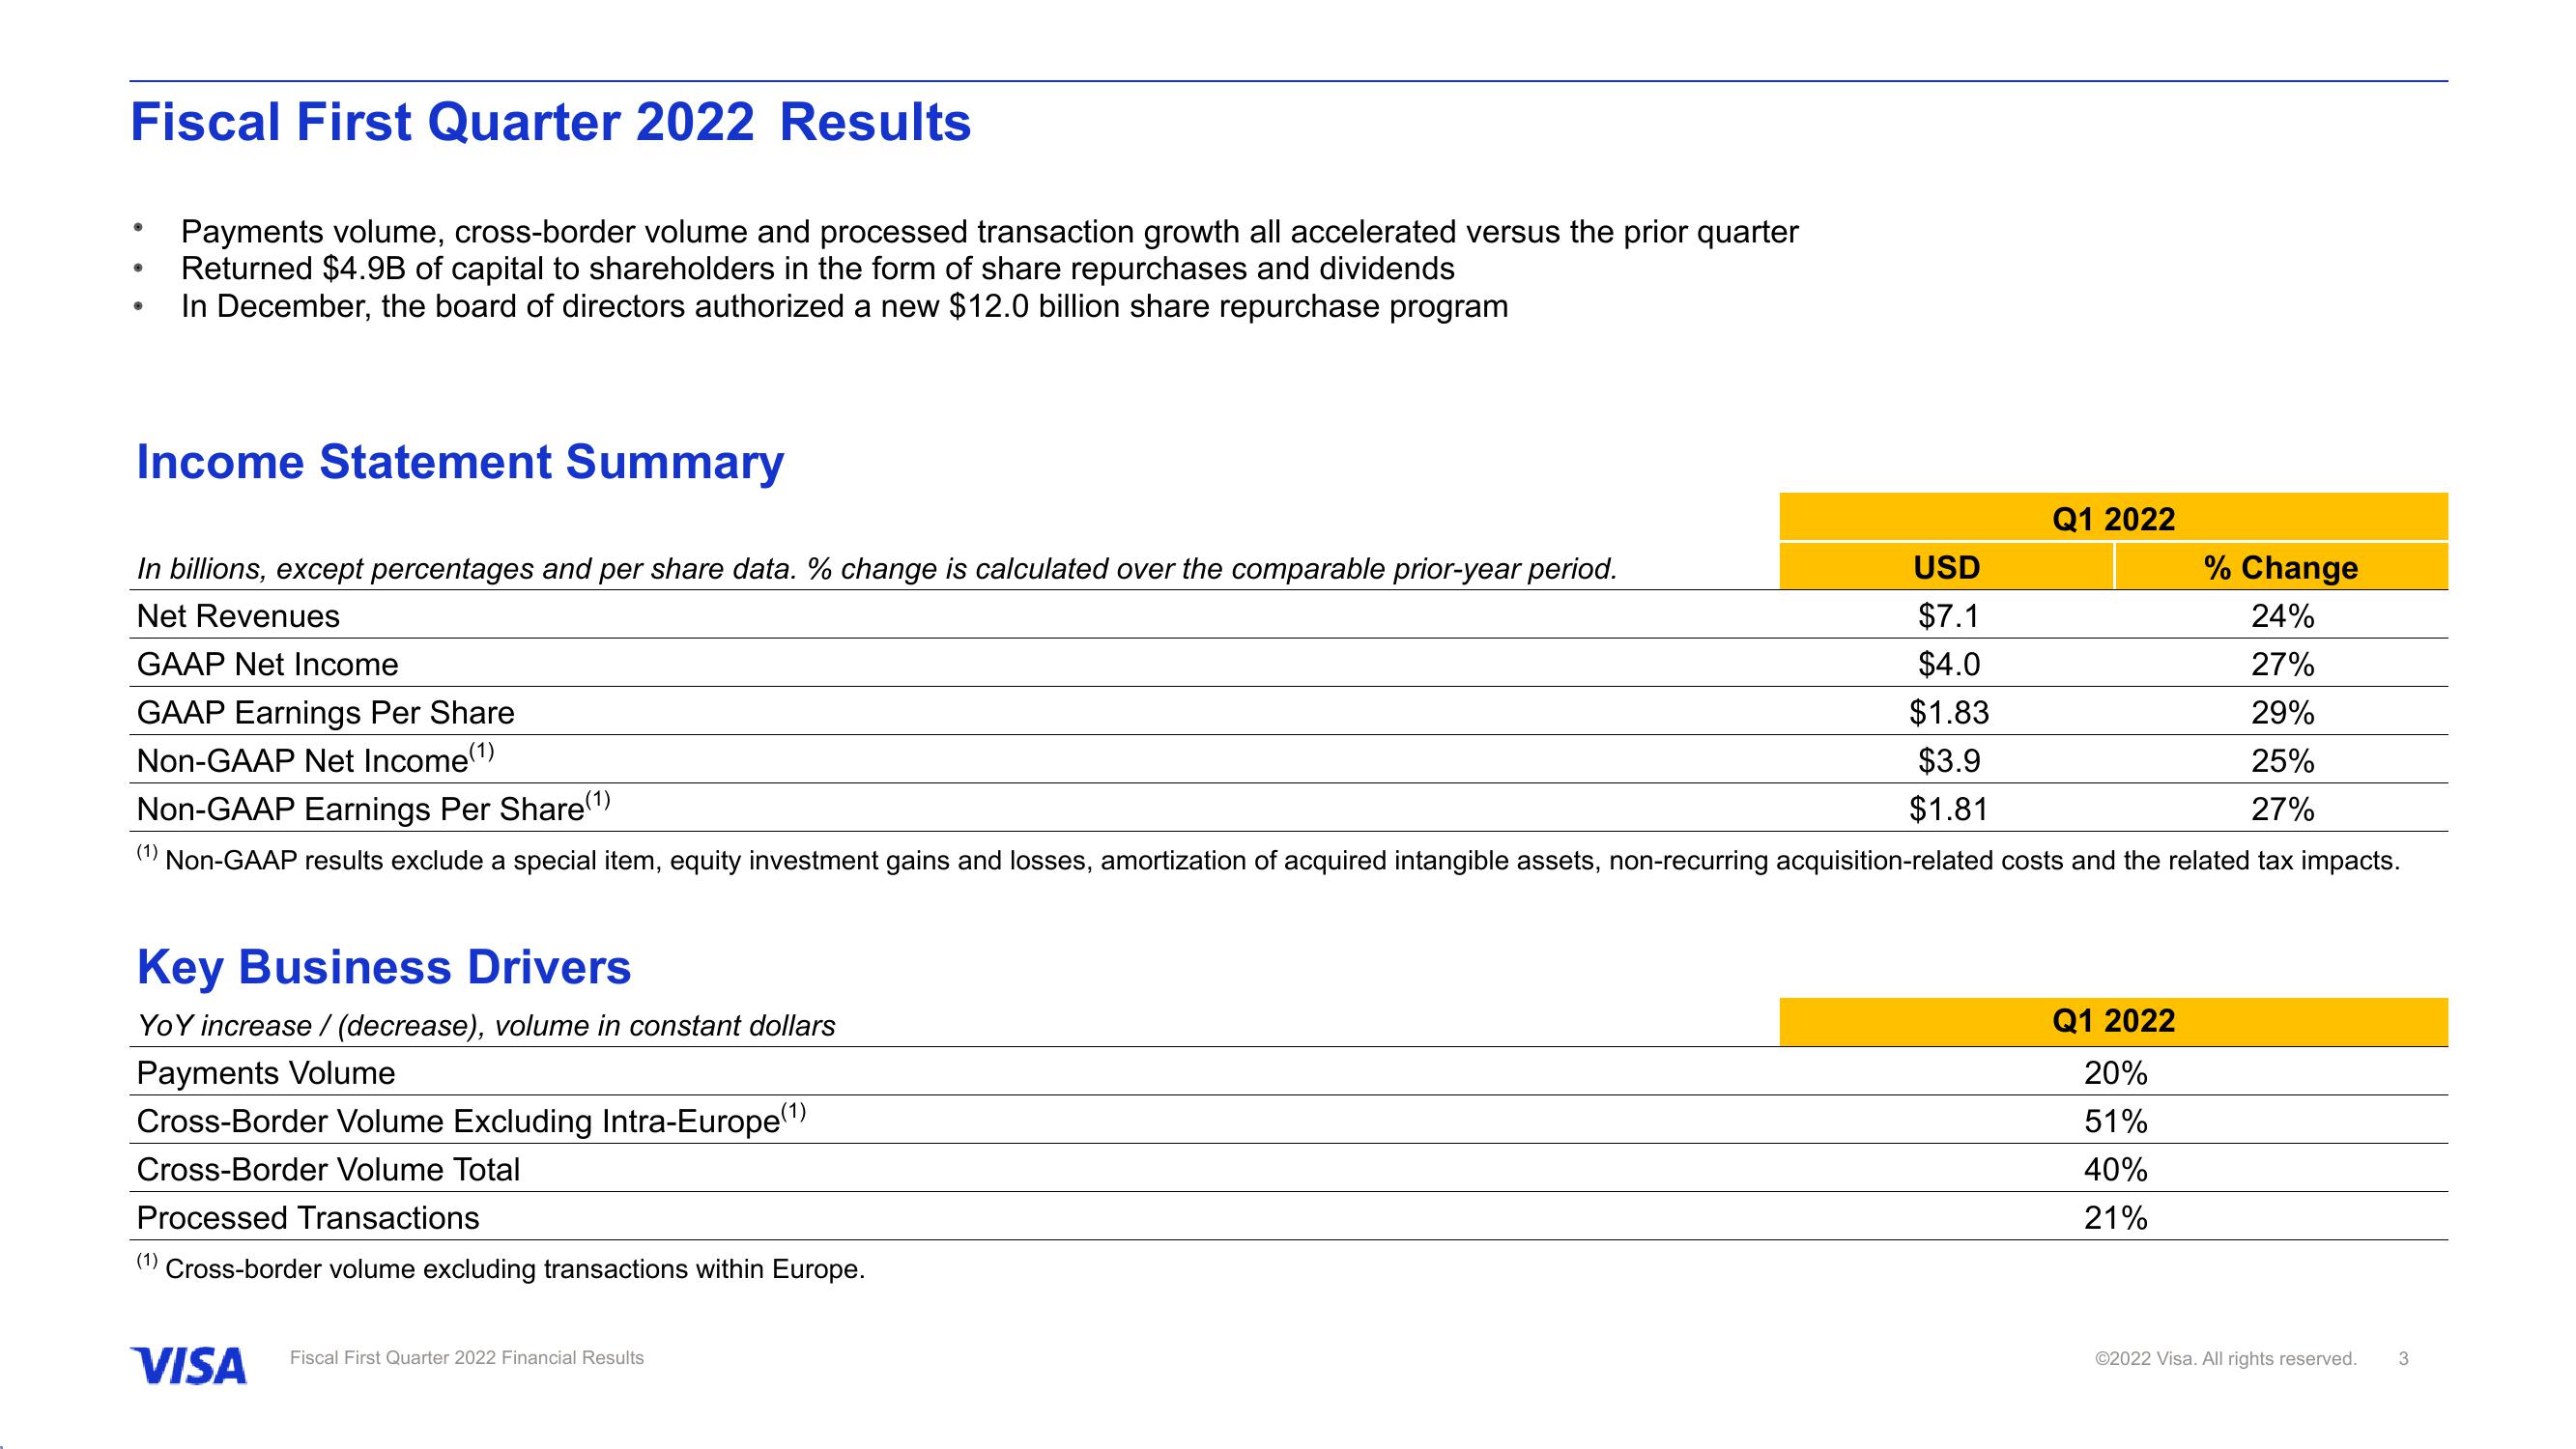
Payments volume, cross-border volume and processed transaction growth all accelerated versus the prior quarter
Returned $4.9B of capital to shareholders in the form of share repurchases and dividends
In December, the board of directors authorized a new $12.0 billion share repurchase program
Income Statement Summary
% Change
In billions, except percentages and per share data. % change is calculated over the comparable prior-year period.
Net Revenues
24%
GAAP Net Income
27%
29%
GAAP Earnings Per Share
Non-GAAP Net Income(¹)
25%
Non-GAAP Earnings Per Share(¹)
27%
(1) Non-GAAP results exclude a special item, equity investment gains and losses, amortization of acquired intangible assets, non-recurring acquisition-related costs and the related tax impacts.
Key Business Drivers
YoY increase / (decrease), volume in constant dollars
Payments Volume
Cross-Border Volume Excluding Intra-Europe(¹)
Cross-Border Volume Total
Processed Transactions
(1) Cross-border volume excluding transactions within Europe.
VISA
Fiscal First Quarter 2022 Financial Results
USD
$7.1
$4.0
$1.83
$3.9
$1.81
Q1 2022
Q1 2022
20%
51%
40%
21%
Ⓒ2022 Visa. All rights reserved. 3View entire presentation