Proterra SPAC Presentation Deck
April 8, 2021
35
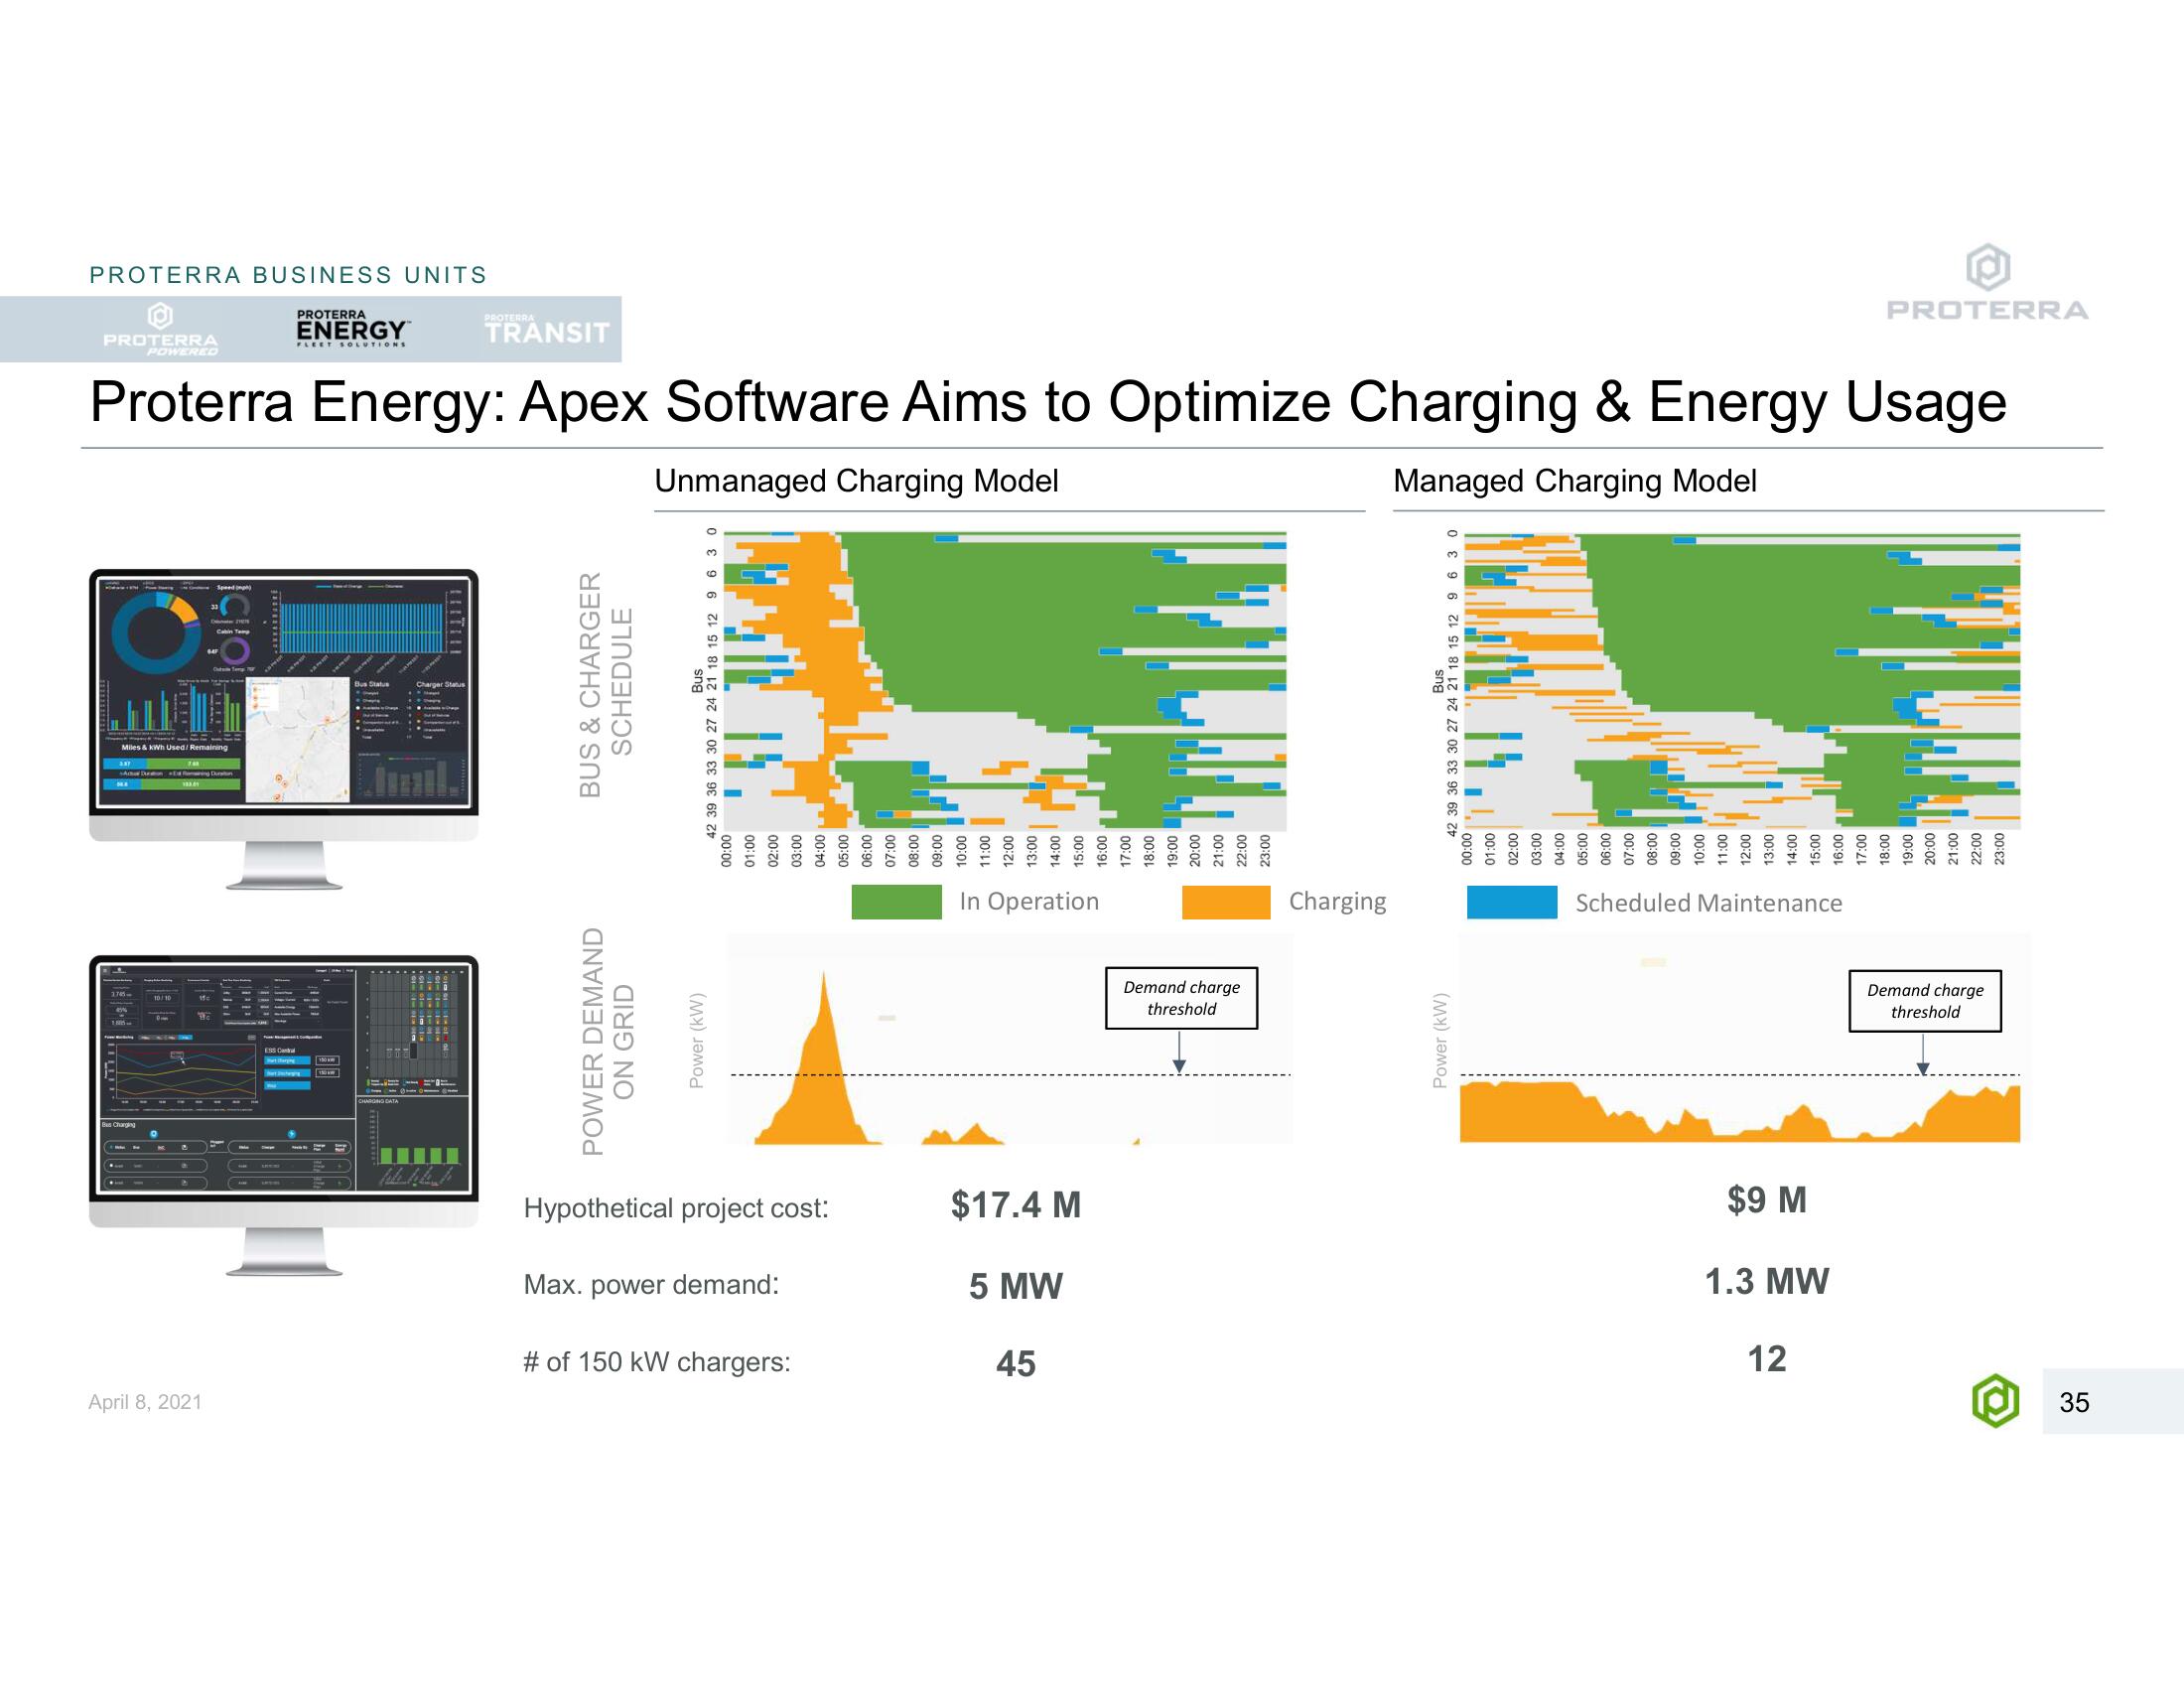
# of 150 kW chargers:
45
12
Max. power demand:
5 MW
1.3 MW
Hypothetical project cost:
$17.4 M
$9 M
42
15:
POWER DEMAND
ON GRID
Power (kW)
threshold
Demand charge
Power (kW)
threshold
Demand charge
In Operation
Charging
Scheduled Maintenance
01:00
02:00
03:00
04:00
05:00
06:00
07:00
08:00
00:60
11:00
13:00
14:00
15:00
16:00
17:00
18:00
19:00
20:00
21:00
22:00
23:00
42 39 36 33 30 27 24 21 18 15 12 9 6 3 0
00:00
01:00
02:00
03:00
04:00
05:00
06:00
07:00
08:00
09:00
3.37
A Dung D
10:00
11:00
12:00
13:00
14:00
15:00
16:00
17:00
18:00
19:00
20:00
21:00
Miles & kWh Used/ Remaining
22:00
23:00
EELNE
ICHQI
O
42 39 36 33 30 27 24 21 18 15 12 9 6 3 0
Speed)
BUS & CHARGER
SCHEDULE
Unmanaged Charging Model
Managed Charging Model
Proterra Energy: Apex Software Aims to Optimize Charging & Energy Usage
POWERED
PROTERRA
FLEET SOLUTIONS
ENERGY™
PROTERRA
PROTERRA
TRANSIT
PROTERRA
PROTERRA BUSINESS UNITSView entire presentation