Barclays Investment Banking Pitch Book
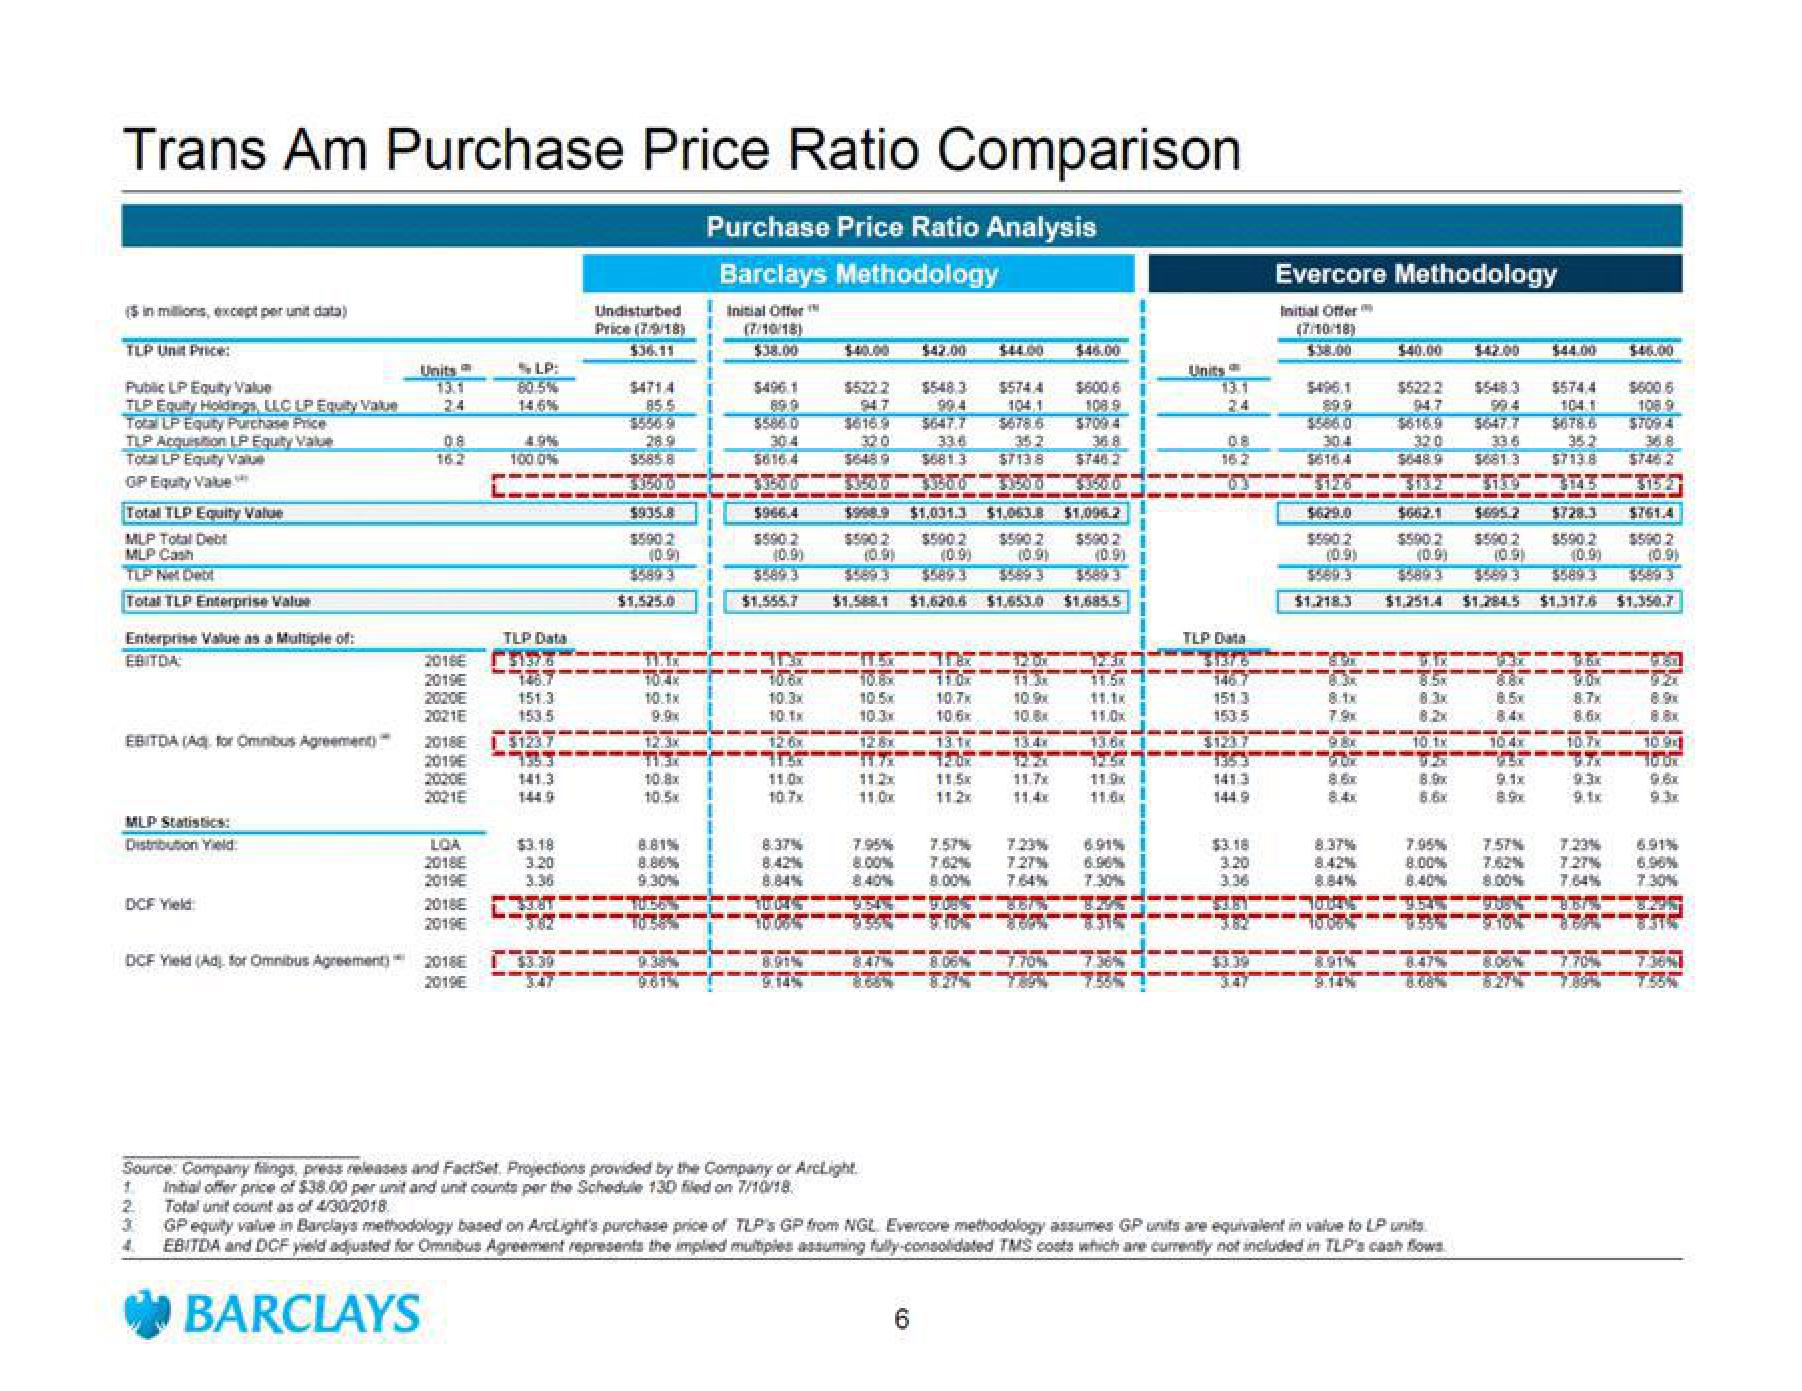
Trans Am Purchase Price Ratio Comparison
Purchase Price Ratio Analysis
Barclays Methodology
Initial Offer
(7/10/18)
$38.00
($ in millions, except per unit data)
TLP Unit Price:
Public LP Equity Value
TLP Equity Holdings, LLC LP Equity Value
Total LP Equity Purchase Price
TLP Acquisition LP Equity Value
Total LP Equity Value
GP Equity Value
Total TLP Equity Value
MLP Total Debt
MLP Cash
TLP Net Debt
Total TLP Enterprise Value
Enterprise Value as a Multiple of:
EBITDA
EBITDA (A) for Omnibus Agreement) *
MLP Statistics:
Distribution Yield:
DCF Yield
DCF Yield (Ad. for Omnibus Agreement)
Units
1
2
3
4
13.1
24
08
2018E
2019E
2020E
2021E
2019E
2020E
2021E
LOA
2018E
2018E
2019E
2018E
2019E
LP:
100.0%
TLP Data
51378
151.3
153.5
$1237
--
1353
141.3
144.9
$3.18
3.20
3.36
STUT
-32
Undisturbed
Price (7/9/18)
$471.4
85.5
28.9
$585.8
$935.8
$590.2
(0.9)
10
10.1x
12.3x
10.8x
195,
8.81%
8.86%
9,30%
ENT
9.61
$496.1
$586.0
$616.4
$350
5590 2
(0.9)
$589.3
$1,555,7
▪▬▬▬▬▬▬▬▬▬▬▬▬▬▬▬
$998.9 $1,031.3
$590.2
10.3x
10.1x
12.6x
TAK
10.7x
8.37%
8.84%
תור ההמ--5--0---15
10005
$44.00
$548,3 $574.4
$647,7
$678.6
336
352
$681.3 $7138
357 3300 3300
8.91%
9.14%
$522.2
547
$616.9
320
-
10.80X
IDE
10.3x
Source: Company flings, press releases and FactSet. Projections provided by the Company or ArcLight
Initial offer price of $38.00 per unit and unit counts per the Schedule 130 filed on 7/10/18
11.0x
7.95%
8.00%
9.55%
--
▬▬▬▬▬
O
$1,620,6 $1,653.0 $1,685.5
6
10.7x
10.6x
$600.6
108.91
$709.41
368 1
$746.2
33.0
$1,063.8 $1,096.2
$590 2 $500 2
(0.9)
(0.9)
13.1K
12.00
fis
11.2x
▬▬▬▬▬▬▬
$45.00
E
11.7x
11.4x
7.57%
7.23%
7.62%
7.27%
8.00% 7:64%
-----
11.0x
13.6x
B
11.9x
6.91%
6.96%
7.30%
TA YA 7551
Units
24
TLP Data
1467
153.5
$123 7
1353
141.3
144.9
3.20
3.36
Evercore Methodology
Initial Offer
(7/10/118)
$38.00
$496.1
$566.0
$616.4
5
$629.0
$590 2
(0.9)
$589.3
$1.218.3
98x
UK
86x
8.4x
$40.00 $42.00 $44.00
$5222 $548.3
94.7
994
$574,4
104 1
$678.6
320
33.6
35.2
$648.9 $681.3 $7138
343
▬▬▬▬▬▬▬▬▬▬▬▬▬▬▬▬▬▬▬▬▬SEL
$695.2 $728.3 $761.4
$590 2 $590.2 $590 2
(0.9) (0.9) (0.9)
8.91%
9.14%
$662.1
$590.2
$589 3
$1,251.4
18.3x
8.2x
10.1x
20
8.9x
8.6x
8.37%
8.42%
8.84%
1600595
7.95%
8.00%
6.40%
9.55%
Total unit count as of 4/30/2018
GP equity value in Barclays methodology based on ArcLight's purchase price of TLP's GP from NGL Evercore methodology assumes GP units are equivalent in value to LP units
EBITDA and DCF yield adjusted for Omnibus Agreement represents the implied multiples assuming fully-consolidated TMS costs which are currently not included in TLP's cash flows
BARCLAYS
$1.284.5 $1.317.6
TATE
9.1x
E
8.7x
8.6x
10.7x
T
9.3x
9.tx
7.57%
7.23%
7.27%
8.00% 7,64%
9.10%
$46.00
869
$600.6
36.8
$746.2
3157
$1,350.7
12
9.6x
6.91%
6.96%
7.30%
T
G
8.68 6274 75 7537View entire presentation