Bausch+Lomb Results Presentation Deck
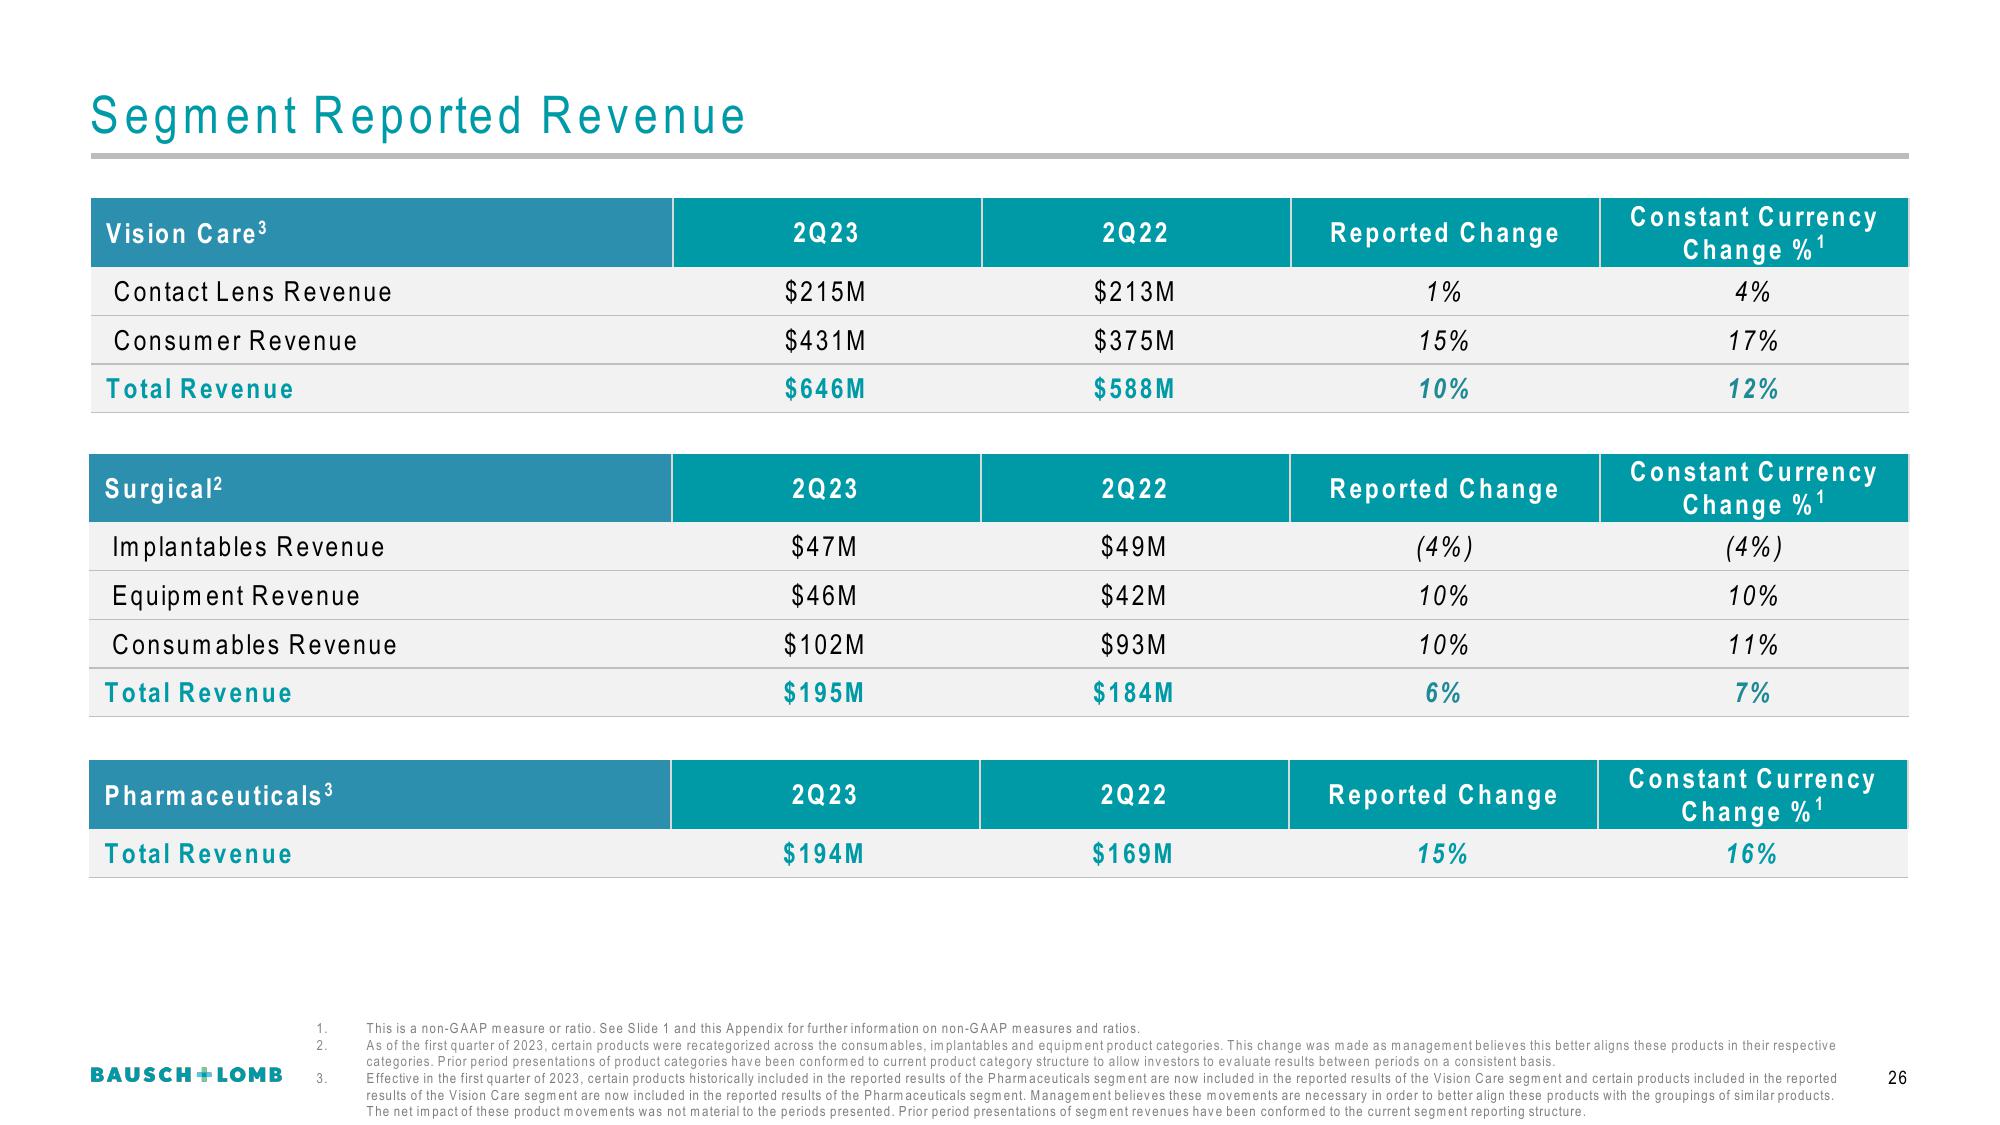
Segment Reported Revenue
Vision Care ³
Contact Lens Revenue
Consumer Revenue
Total Revenue
Surgical²
Implantables Revenue
Equipment Revenue
Consumables Revenue
Total Revenue
Pharmaceuticals ³
Total Revenue
BAUSCH + LOMB
1.
2.
3.
2Q23
$215M
$431M
$646M
2Q23
$47M
$46M
$102M
$195M
2Q23
$194M
2Q22
$213M
$375M
$588 M
2Q22
$49M
$42M
$93M
$184M
2Q22
$169M
Reported Change
1%
15%
10%
Reported Change
(4%)
10%
10%
6%
Reported Change
15%
Constant Currency
Change %¹
4%
17%
12%
Constant Currency
Change %¹
(4%)
10%
11%
7%
Constant Currency
Change %¹
16%
This is a non-GAAP measure or ratio. See Slide 1 and this Appendix for further information on non-GAAP measures and ratios.
As of the first quarter of 2023, certain products were recategorized across the consumables, implantables and equipment product categories. This change was made as management believes this better aligns these products in their respective
categories. Prior period presentations of product categories have been conformed to current product category structure to allow investors to evaluate results between periods on a consistent basis.
Effective in the first quarter of 2023, certain products historically included in the reported results of the Pharmaceuticals segment are now included in the reported results of the Vision Care segment and certain products included in the reported
results of the Vision Care segment are now included in the reported results of the Pharmaceuticals segment. Management believes these movements are necessary in order to better align these products with the groupings of similar products.
The net impact of these product movements was not material to the periods presented. Prior period presentations of segment revenues have been conformed to the current segment reporting structure.
26View entire presentation