40th Annual J.P. Morgan Healthcare Conference Presentation
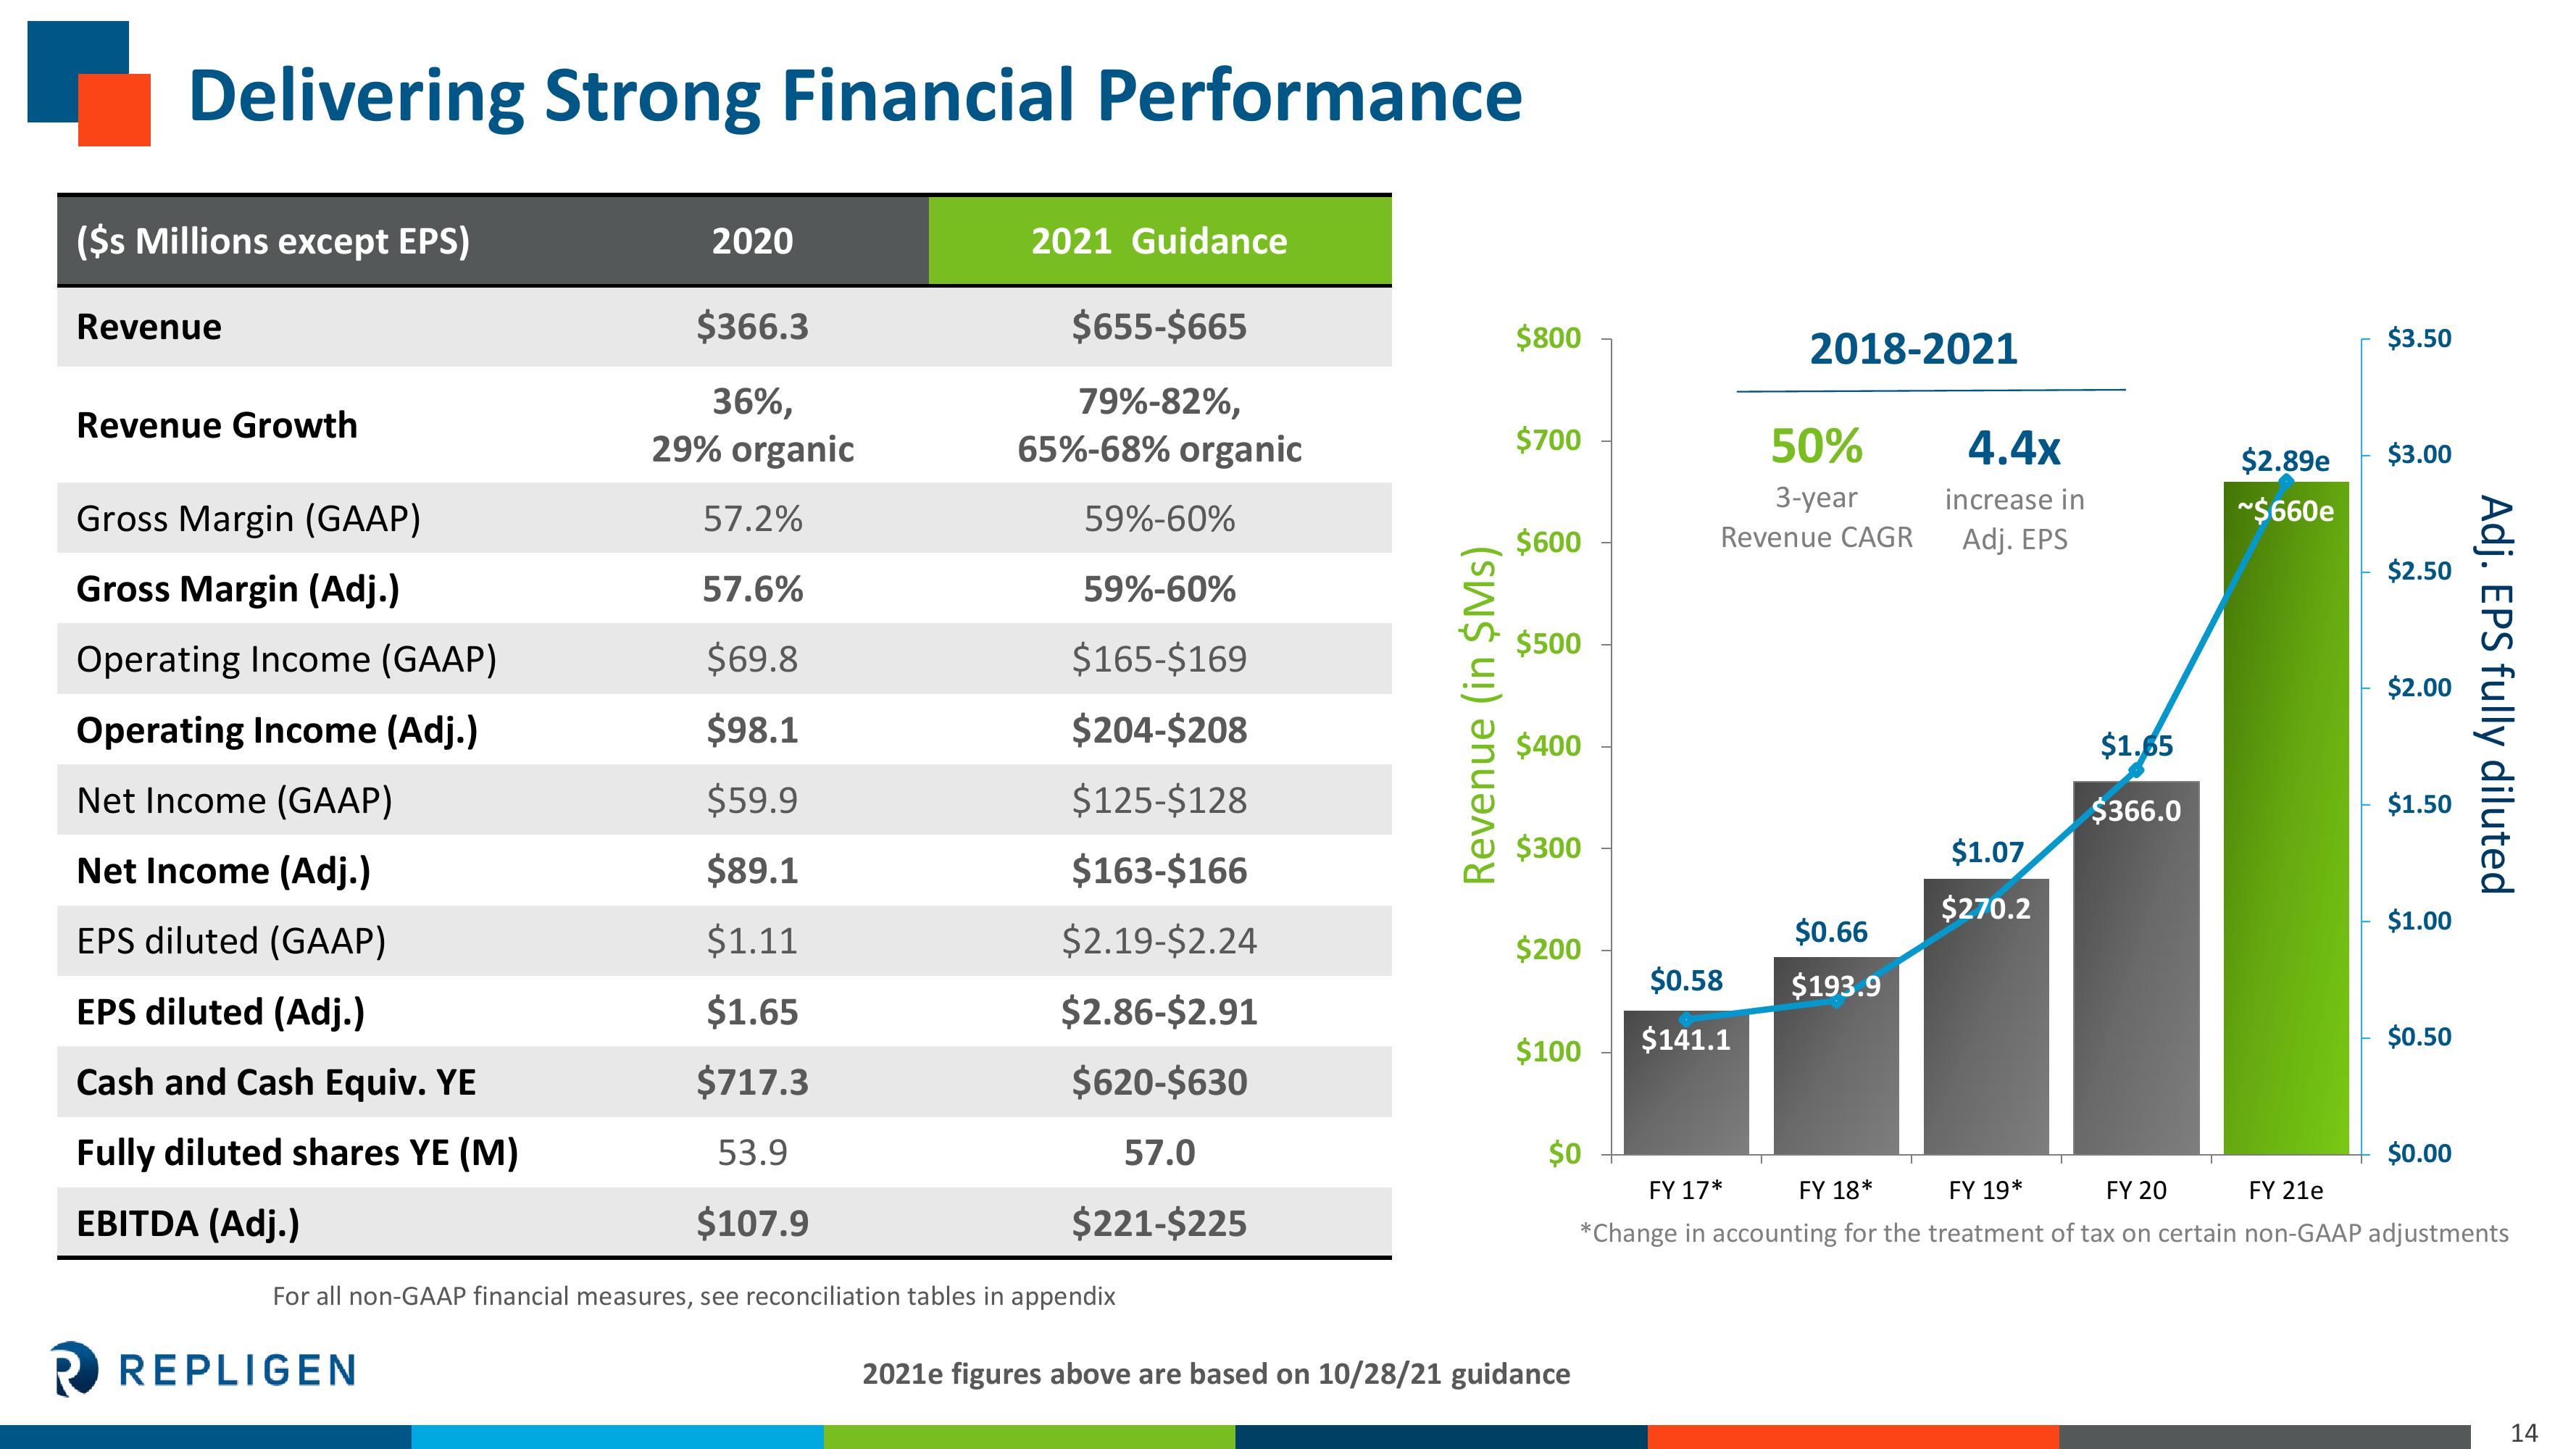
Delivering Strong Financial Performance
($s Millions except EPS)
Revenue
Revenue Growth
Gross Margin (GAAP)
Gross Margin (Adj.)
$366.3
36%,
29% organic
57.2%
57.6%
$69.8
$98.1
$59.9
$89.1
$1.11
$1.65
$717.3
53.9
$107.9
For all non-GAAP financial measures, see reconciliation tables in appendix
Operating Income (GAAP)
Operating Income (Adj.)
Net Income (GAAP)
Net Income (Adj.)
EPS diluted (GAAP)
EPS diluted (Adj.)
Cash and Cash Equiv. YE
Fully diluted shares YE (M)
EBITDA (Adj.)
2020
R REPLIGEN
2021 Guidance
$655-$665
79%-82%,
65%-68% organic
59%-60%
59%-60%
$165-$169
$204-$208
$125-$128
$163-$166
$2.19-$2.24
$2.86-$2.91
$620-$630
57.0
$221-$225
Revenue (in $Ms)
$800
$700
$600
$500
$400
$300
$200
$100
$0
2021e figures above are based on 10/28/21 guidance
2018-2021
50%
3-year
Revenue CAGR
$0.58
$141.1
$0.66
$193.9
4.4x
increase in
Adj. EPS
$1.07
$270.2
$1.65
$366.0
$2.89e
~$660e
$3.50
$3.00
$2.50
$2.00
$1.50
$1.00
$0.50
$0.00
Adj. EPS fully diluted
FY 19*
FY 20
FY 17*
FY 18*
FY 21e
*Change in accounting for the treatment of tax on certain non-GAAP adjustments
14View entire presentation