Baird Investment Banking Pitch Book
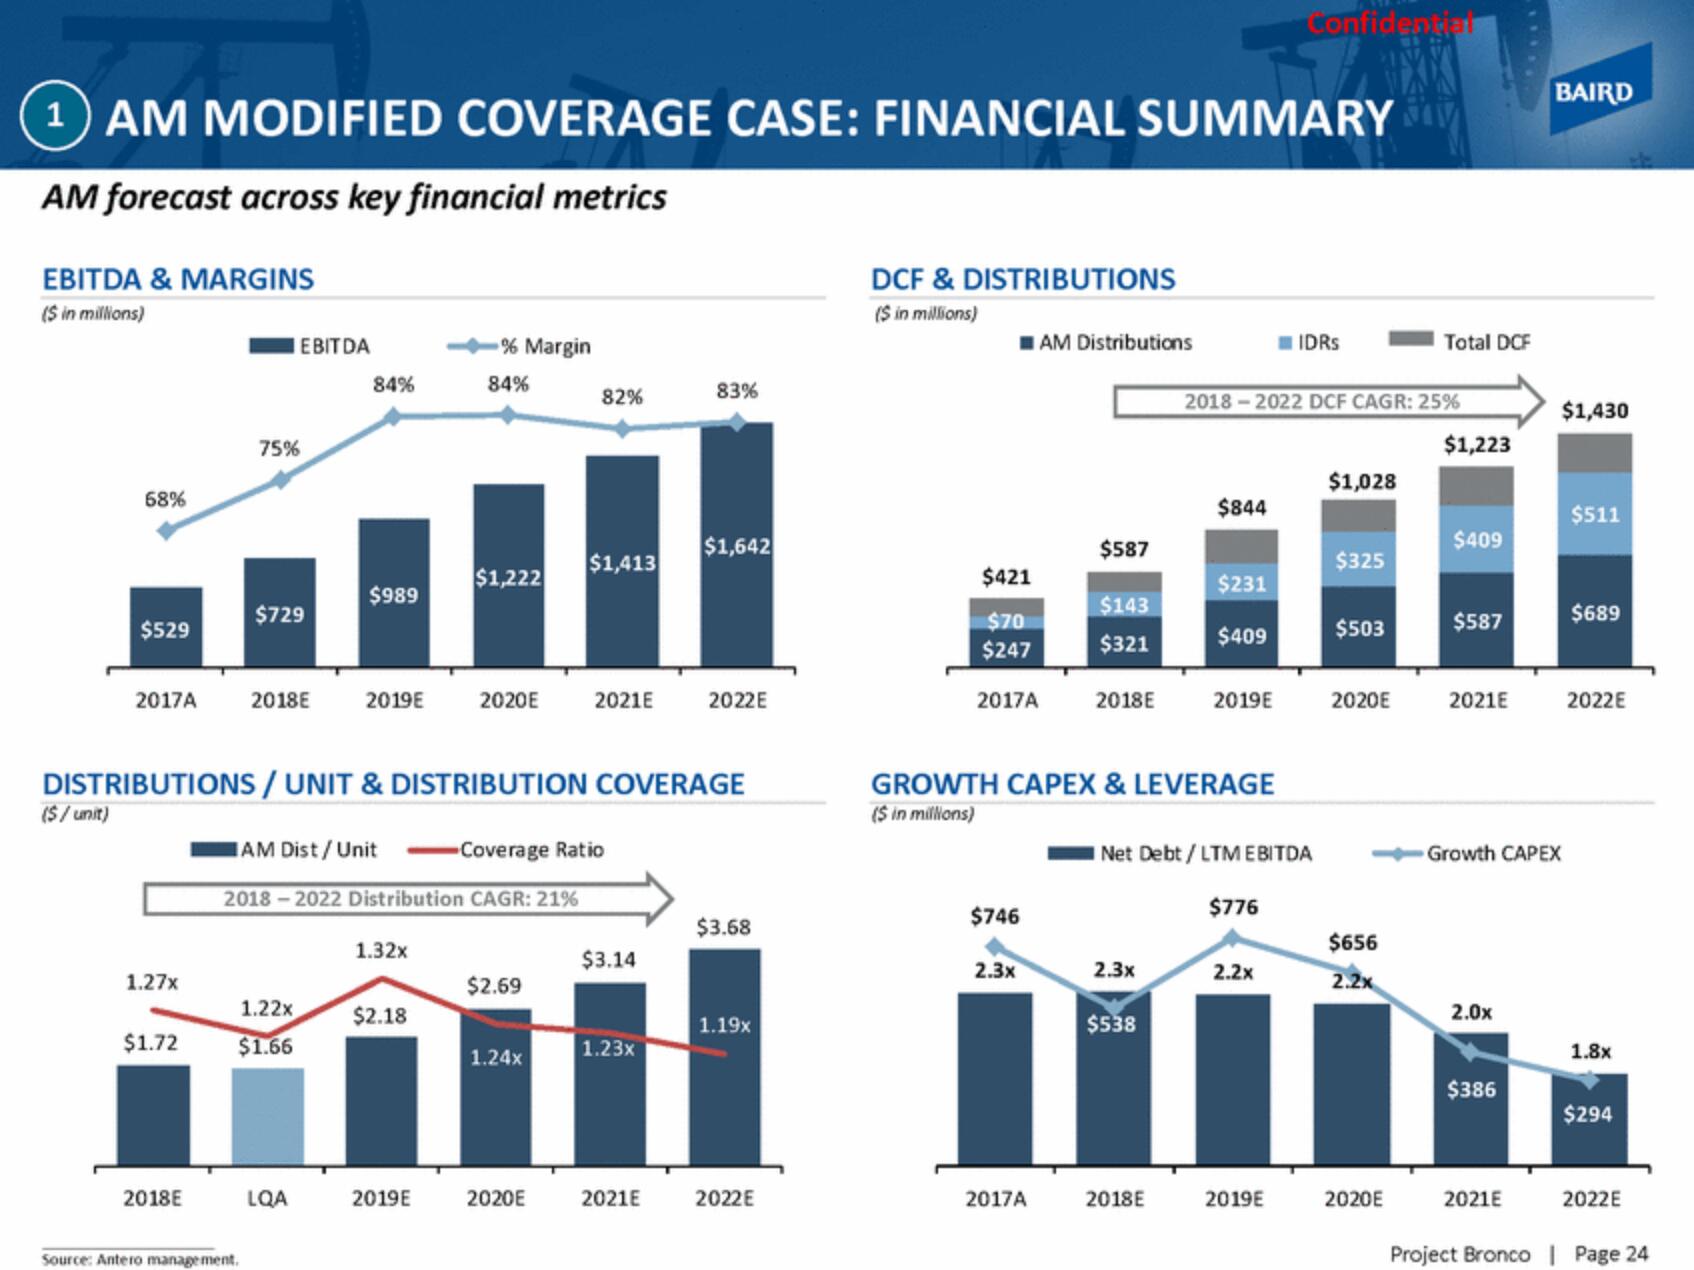
1 AM MODIFIED COVERAGE CASE: FINANCIAL SUMMARY
AM forecast across key financial metrics
EBITDA & MARGINS
($ in millions)
68%
($/ unit)
$529
1.27x
$1.72
75%
2018E
$729
EBITDA
Source: Antero management.
84%
1.22x
$1.66
$989
AM Dist/ Unit
2017A 2018E 2019E 2020E 2021E 2022E
DISTRIBUTIONS / UNIT & DISTRIBUTION COVERAGE
LQA
-% Margin
84%
-Coverage Ratio
2018-2022 Distribution CAGR: 21%
1.32x
$1,222
$2.18
2019E
82%
$2.69
$1,413
| 1.24x
2020E
$3.14
83%
1.23x
$1,642
2021E
$3.68
1.19x
2022E
DCF & DISTRIBUTIONS
($ in millions)
$421
$70
$247
2017A
$746
AM Distributions
2.3x
2017A
$587
$143
$321
2018E
GROWTH CAPEX & LEVERAGE
($ in millions)
2.3x
$538
$844
2018E
$231
$409
2018-2022 DCF CAGR: 25%
2019E
Net Debt/LTM EBITDA
Confidential
$776
2.2x
IDRS
2019E
$1,028
$325
$503
2020E
$656
2.2x
Total DCF
2020E
$1,223
$409
$587
2021E
2.0x
Growth CAPEX
$386
BAIRD
2021E
$1,430
$511
$689
2022E
1.8x
$294
2022E
Project Bronco | Page 24View entire presentation