OppFi Results Presentation Deck
13
Growth Rebounded in the Second Quarter
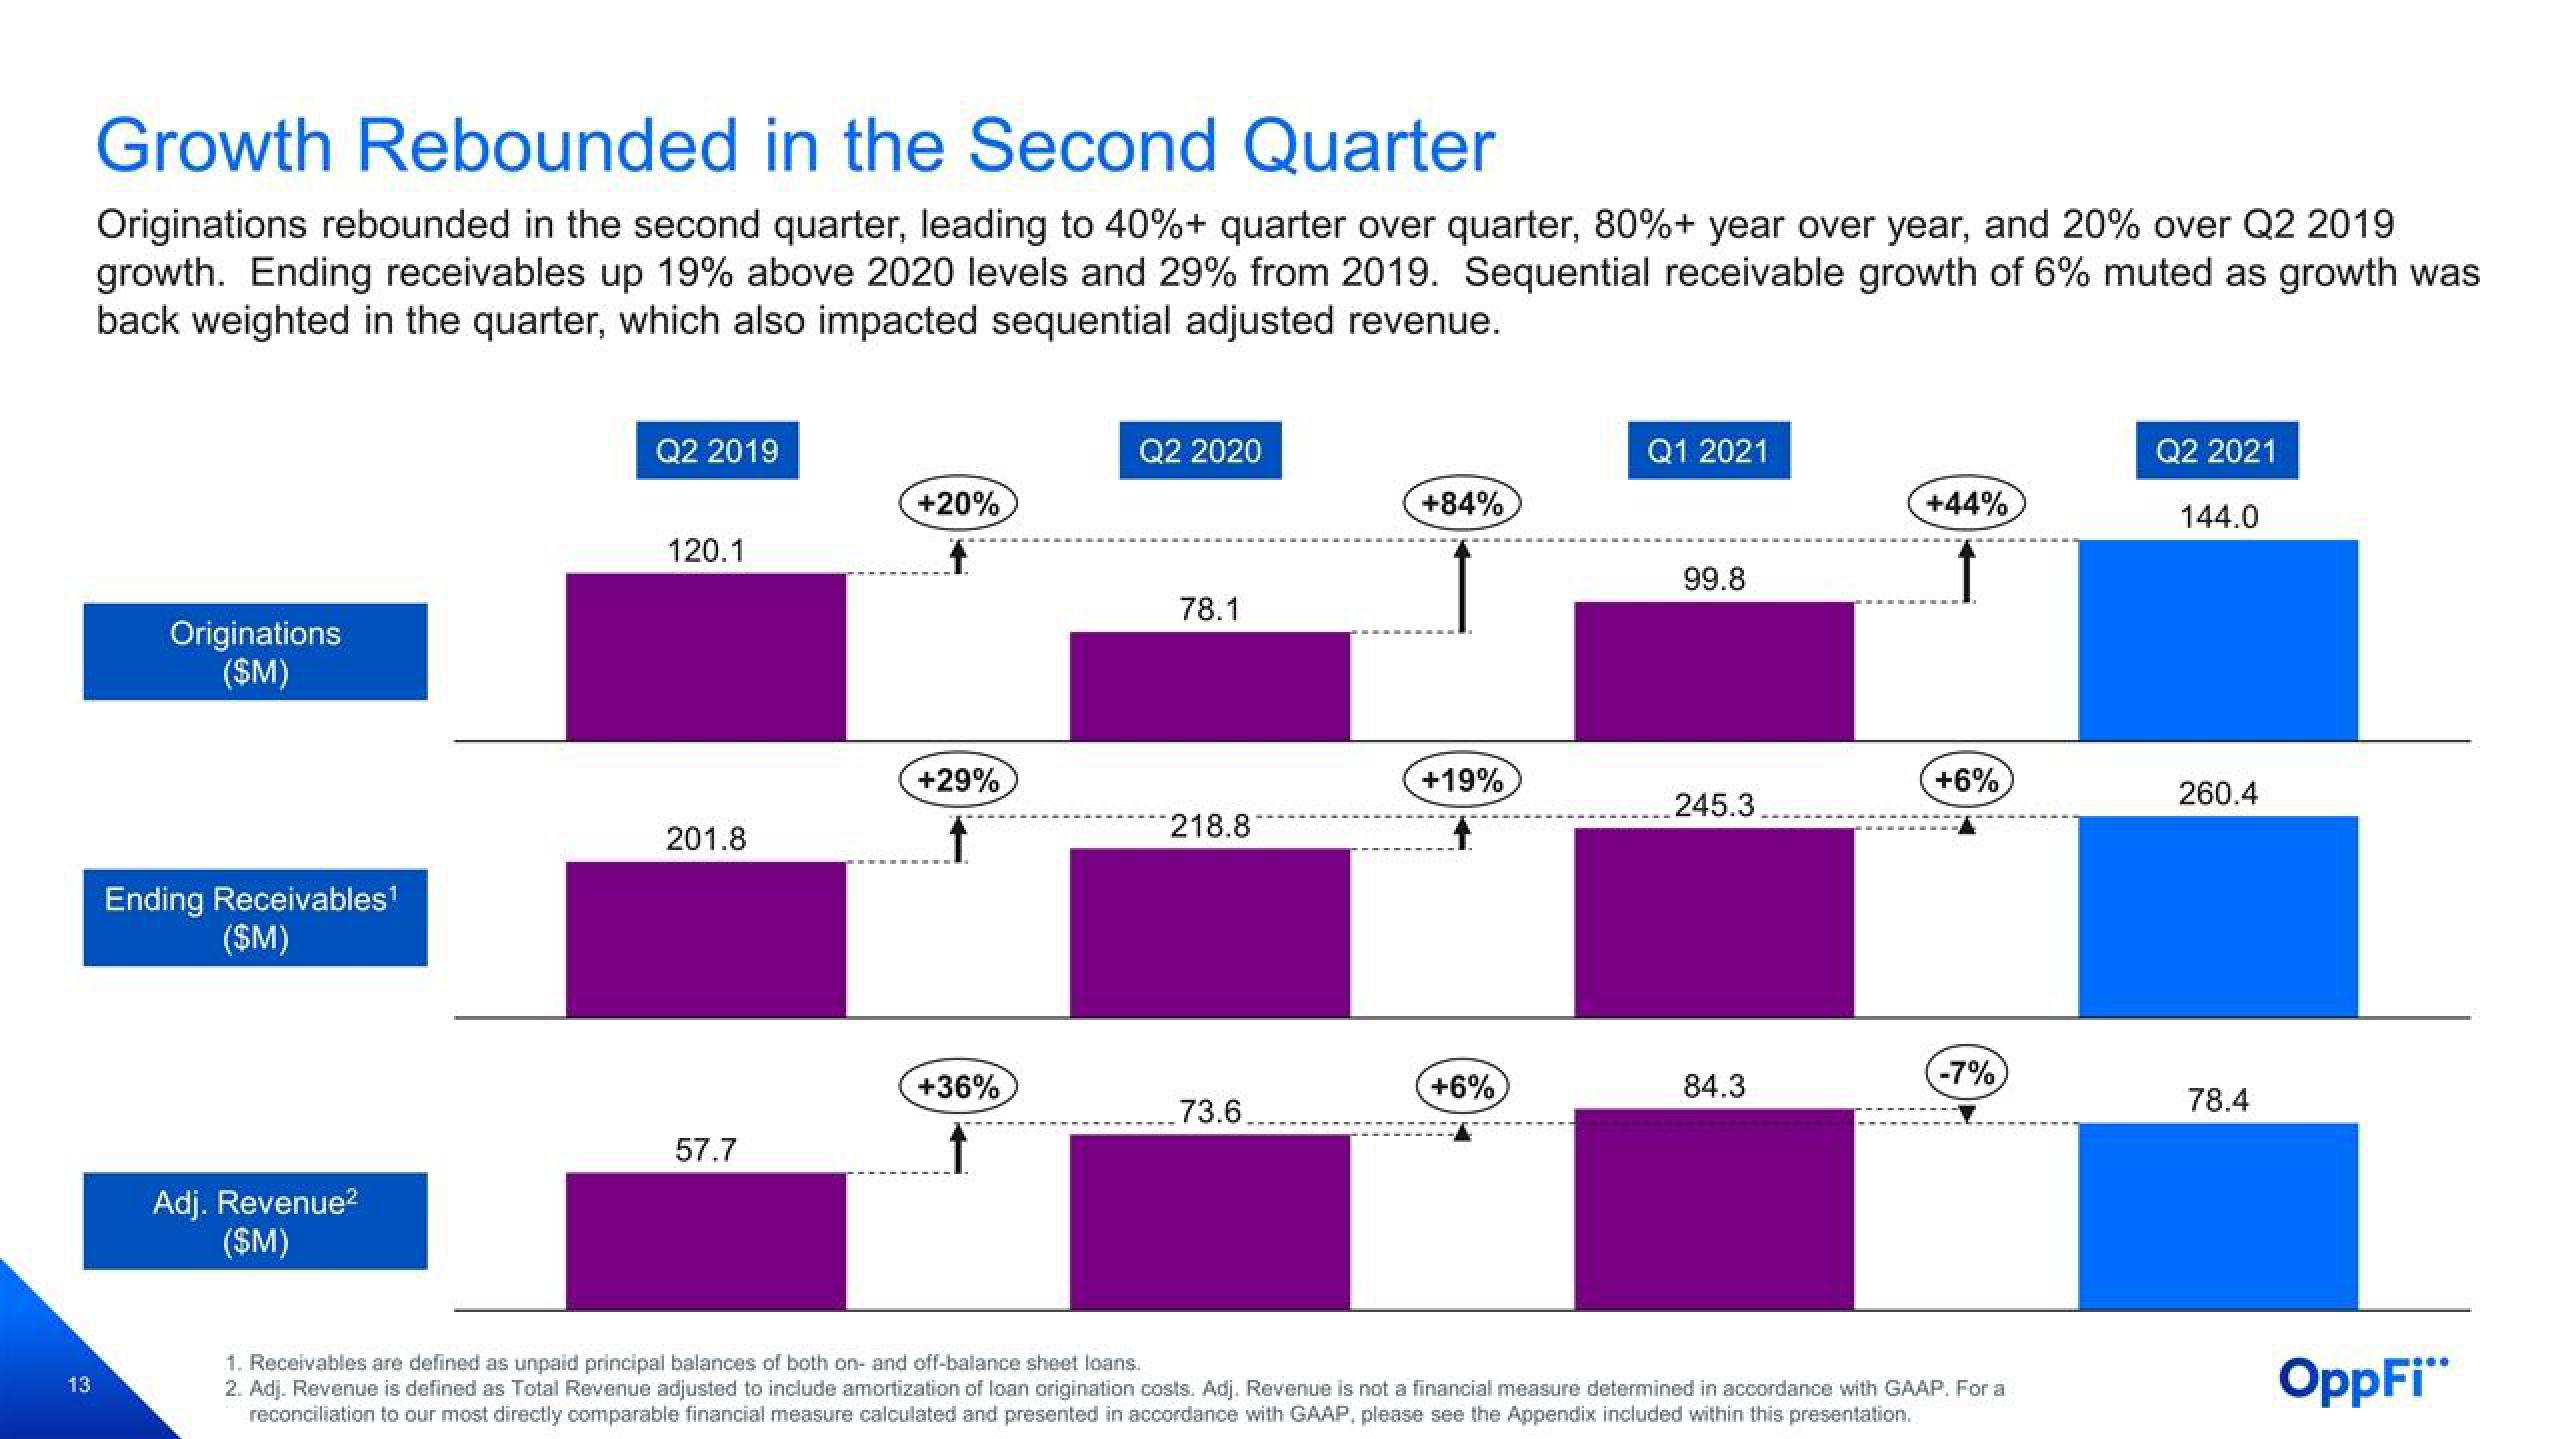
Originations rebounded in the second quarter, leading to 40%+ quarter over quarter, 80%+ year over year, and 20% over Q2 2019
growth. Ending receivables up 19% above 2020 levels and 29% from 2019. Sequential receivable growth of 6% muted as growth was
back weighted in the quarter, which also impacted sequential adjusted revenue.
Originations
($M)
Ending Receivables¹
($M)
Adj. Revenue²
(SM)
Q2 2019
120.1
201.8
57.7
+20%
+29%
+36%
Q2 2020
78.1
218.8
73.6.
+84%
+19%
+6%
Q1 2021
99.8
245.3.
84.3
+44%
+6%
-7%
1. Receivables are defined as unpaid principal balances of both on- and off-balance sheet loans.
2. Adj. Revenue is defined as Total Revenue adjusted to include amortization of loan origination costs. Adj. Revenue is not a financial measure determined in accordance with GAAP. For a
reconciliation to our most directly comparable financial measure calculated and presented in accordance with GAAP, please see the Appendix included within this presentation.
Q2 2021
144.0
260.4
78.4
OppFi"View entire presentation